On this page
Everything you need to install, operate, and administer Roundhouse — from docker compose up to a fleet of deployed MCP servers.
Getting started#
Roundhouse runs entirely on your own hardware. The only requirements are Docker and Docker Compose — there is no cloud dependency, no external service to sign up for, and no telemetry.
Install#
Roundhouse runs from a published image — no clone, no build. Download the single-host Compose file and bring it up:
curl -O https://raw.githubusercontent.com/Karmatek-Consulting-LLC/roundhouse/main/docker-compose.yml
docker compose up -d
docker compose logs -f platform-api   # watch for "Application startup complete", then Ctrl-C
Once the logs print Application startup complete, the platform is live at http://localhost:3080.
(Building from source instead? Clone the repo and use docker-compose.dev.yml, which builds the image and hot-reloads the api/ and frontend/ source.)
To stop the platform:
docker compose down        # preserve database + spec files
docker compose down -v     # wipe everything
Sign in#
Roundhouse uses email/password sign-in. The first admin is created from the ADMIN_EMAIL and ADMIN_PASSWORD environment variables when the API boots (defaults: admin@mcp.local / admin — override them in your environment before first boot, or change them from the Users page after).
Connecting clients#
Every deployed server gets a stable URL like http://localhost:3080/s/my-server/mcp. Traefik routes MCP clients straight to the spawned container — the platform never proxies MCP traffic on the hot path.
Callers authenticate with a bearer token minted on the server's Auth tab (see Auth below).
Claude Desktop#
Add to claude_desktop_config.json:
{
  "mcpServers": {
    "my-server": {
      "url": "http://localhost:3080/s/my-server/mcp",
      "headers": {
        "Authorization": "Bearer <token from the server's Auth panel>"
      }
    }
  }
}
Claude Code#
claude mcp add my-server \
  --url    http://localhost:3080/s/my-server/mcp \
  --header "Authorization: Bearer <token>"
Any other MCP client that speaks streamable HTTP works the same way: point it at the server URL and pass the token in the Authorization header.
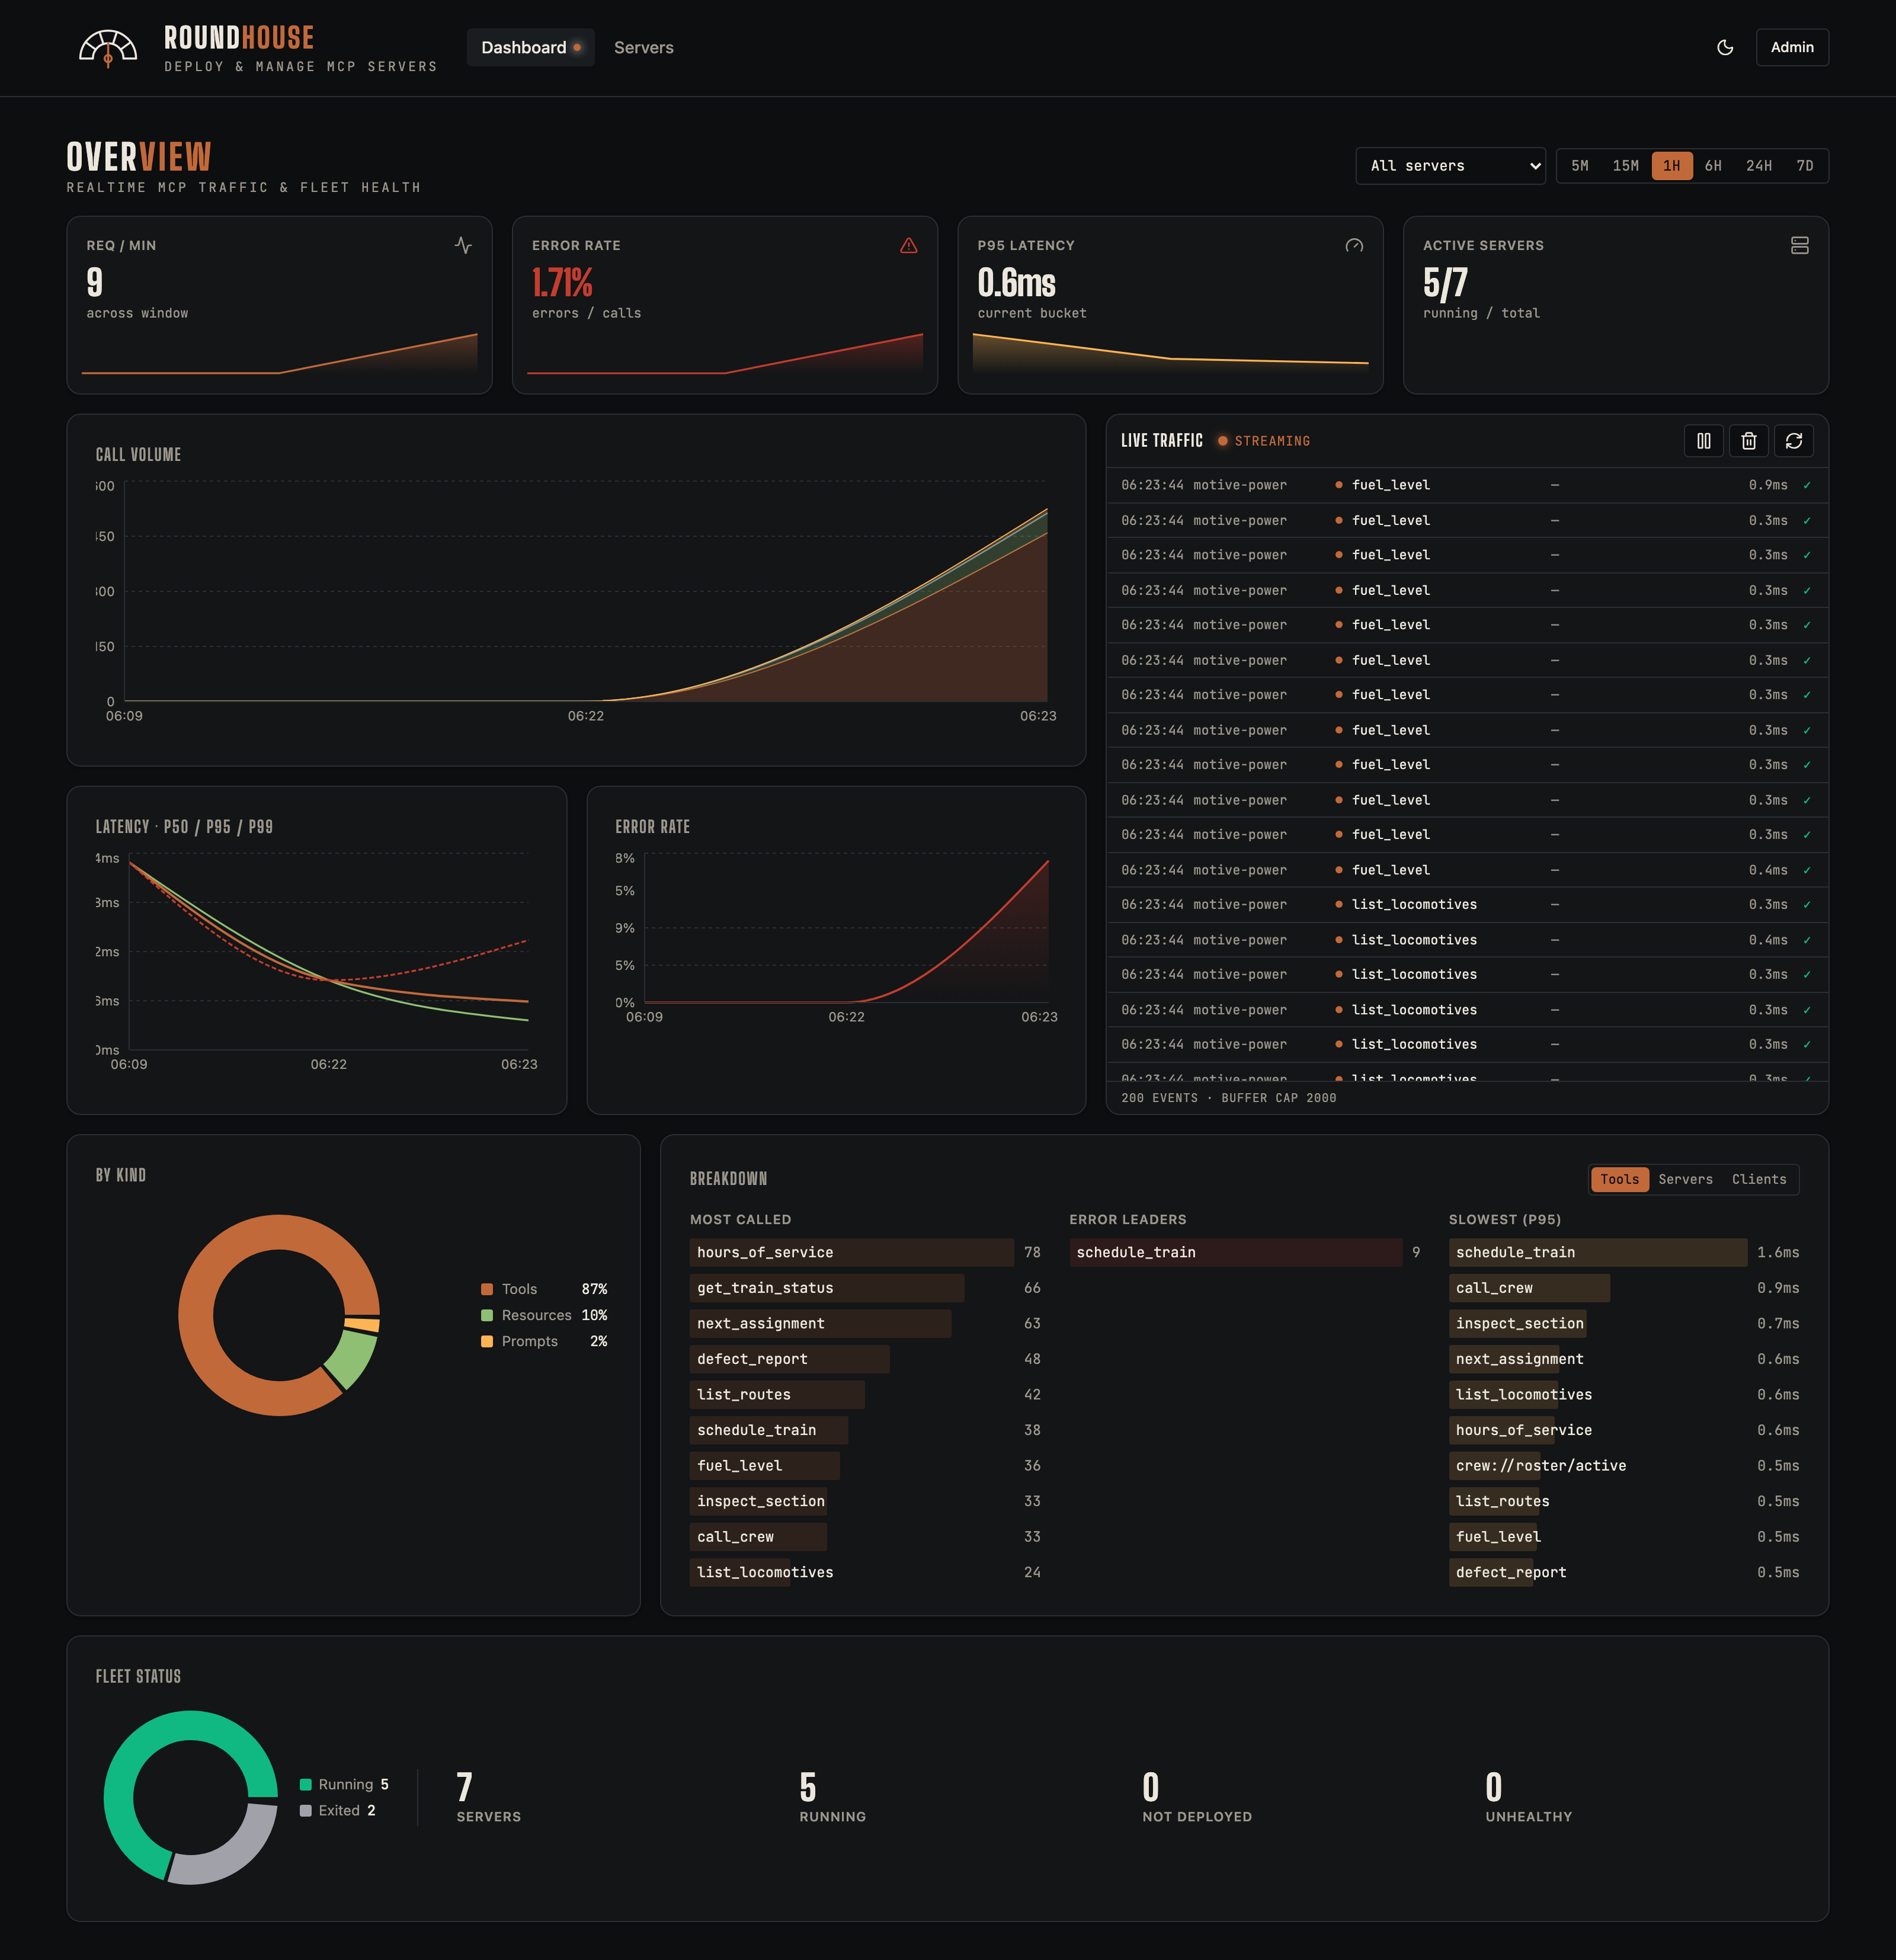
Dashboard#
The dashboard is the home view after sign-in. It surfaces fleet-wide health (running/stopped/errored counts), recent call volume, the busiest servers, and a rolling activity timeline.
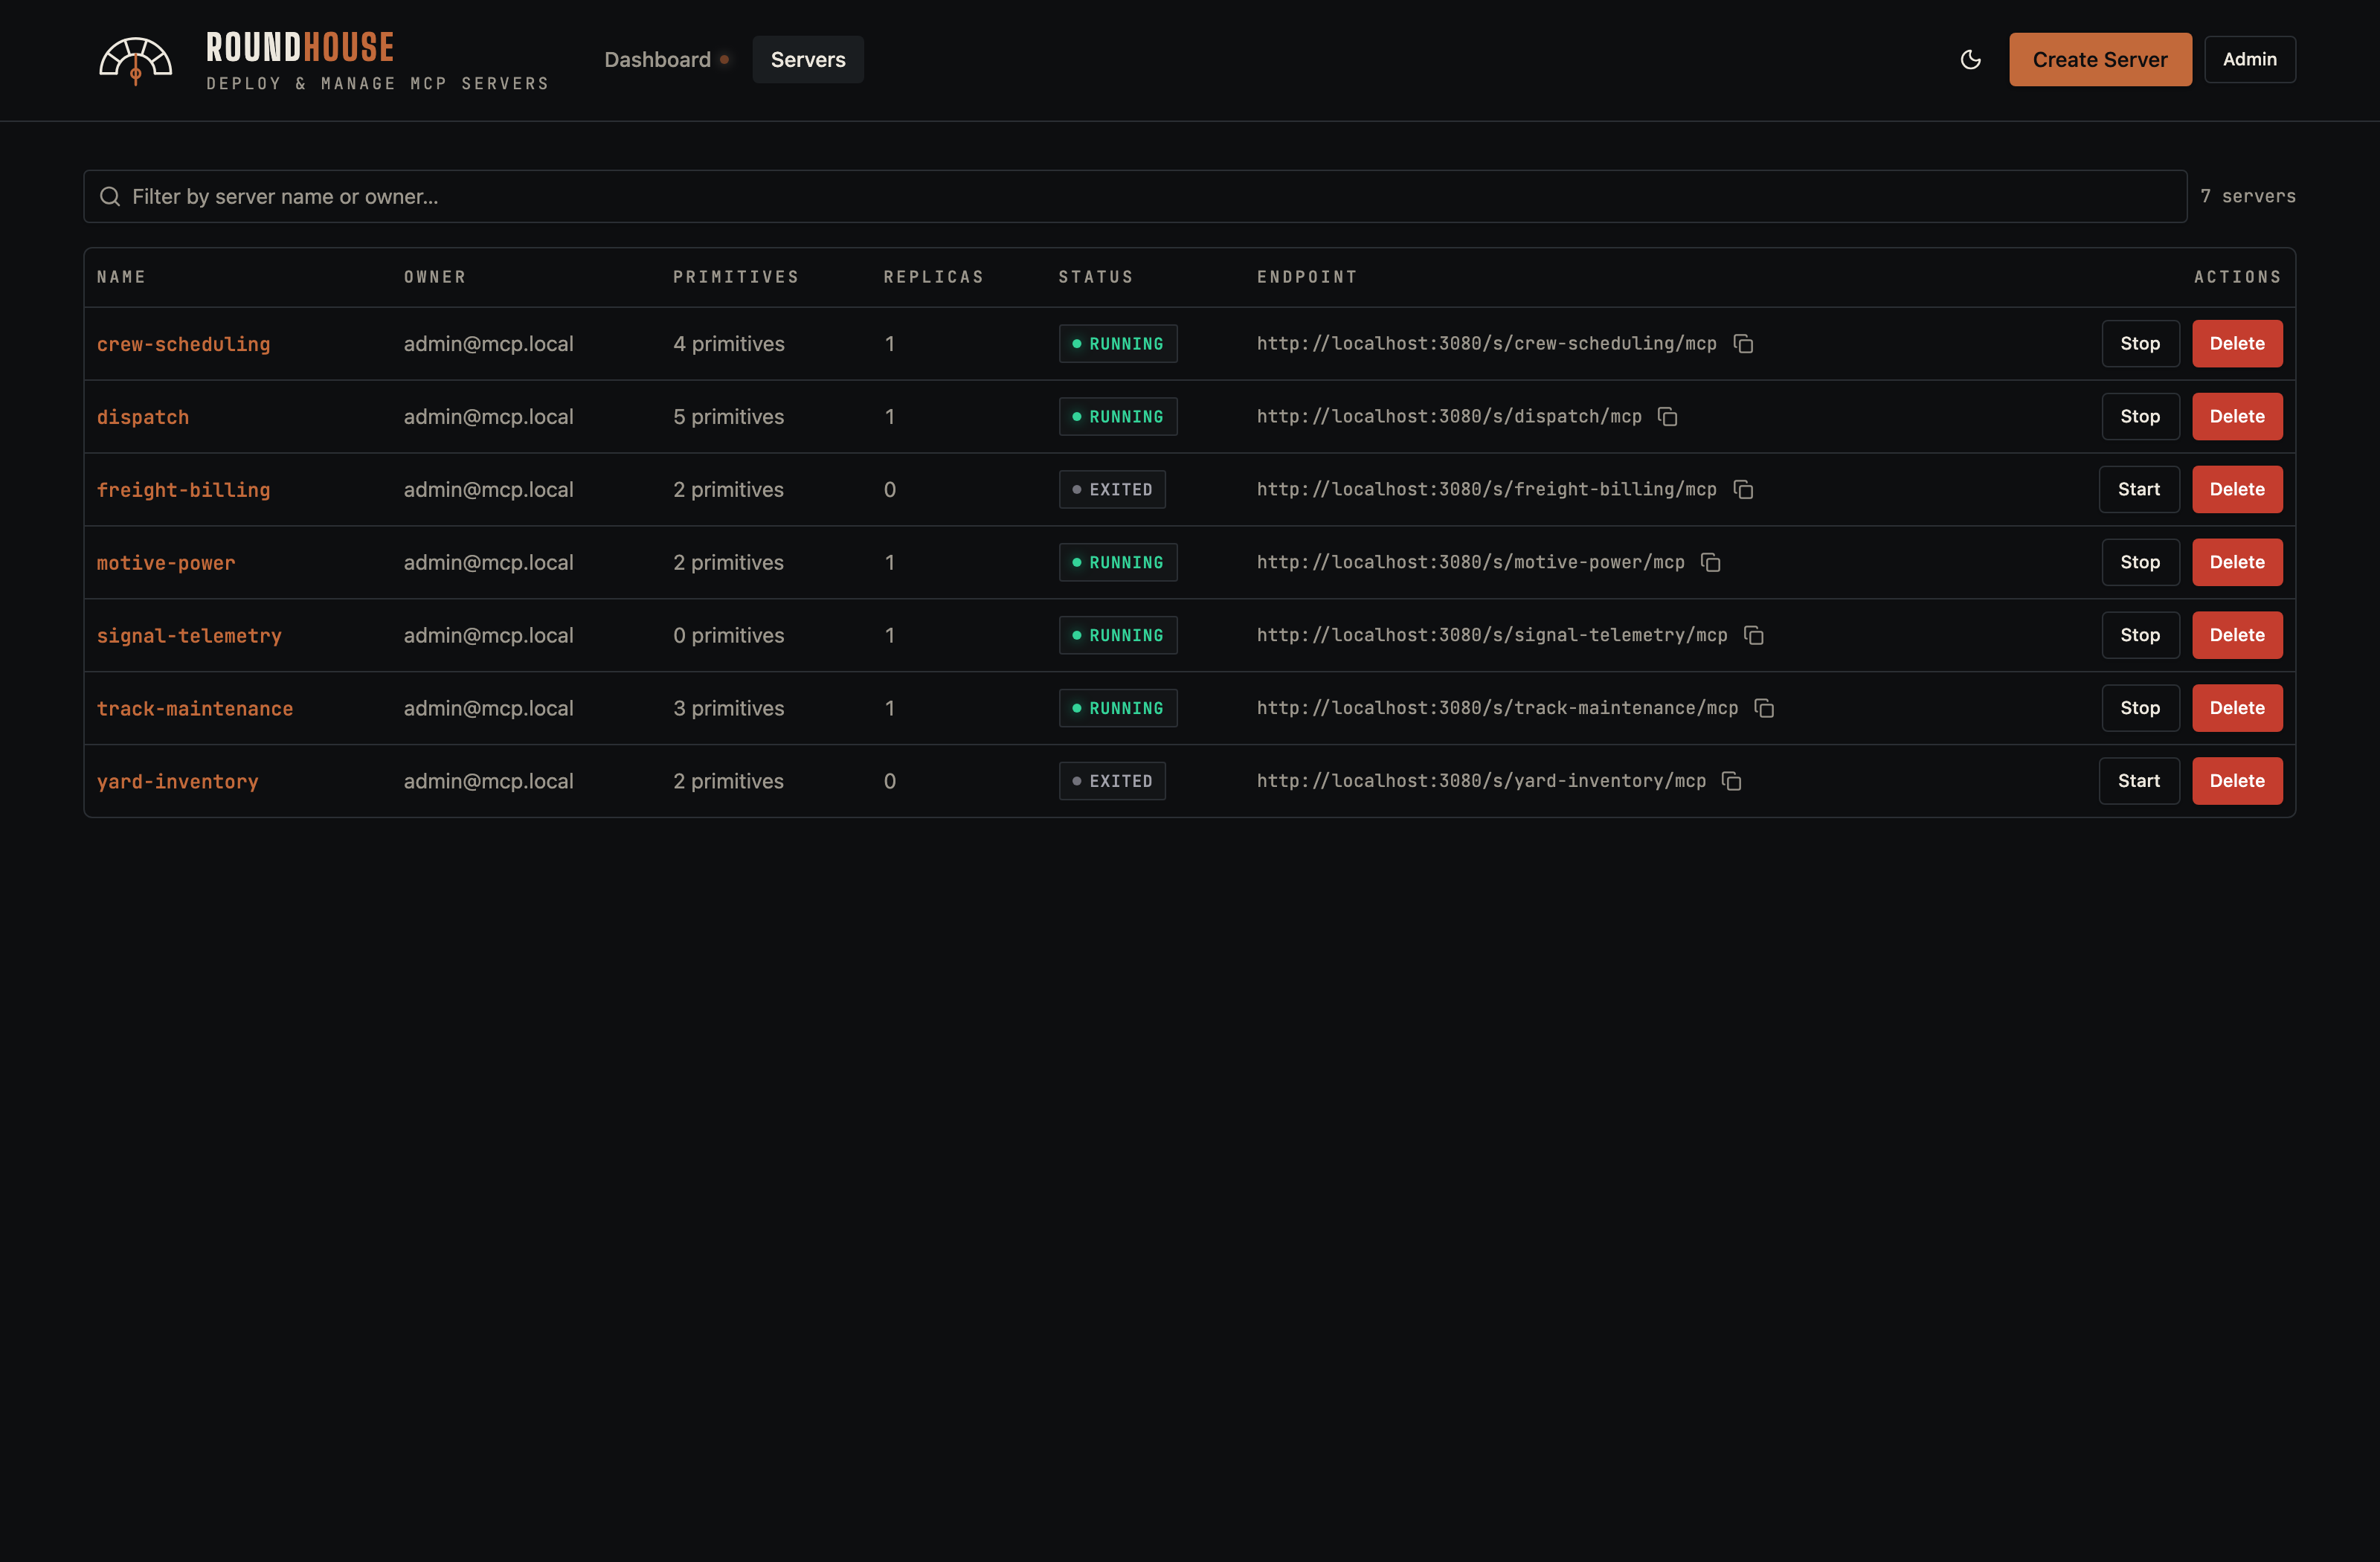
Servers list#
The full inventory of MCP servers you can see. Each row shows the server's deploy mode (structured or code), live status, recent call count, and quick actions.
Creating a server#
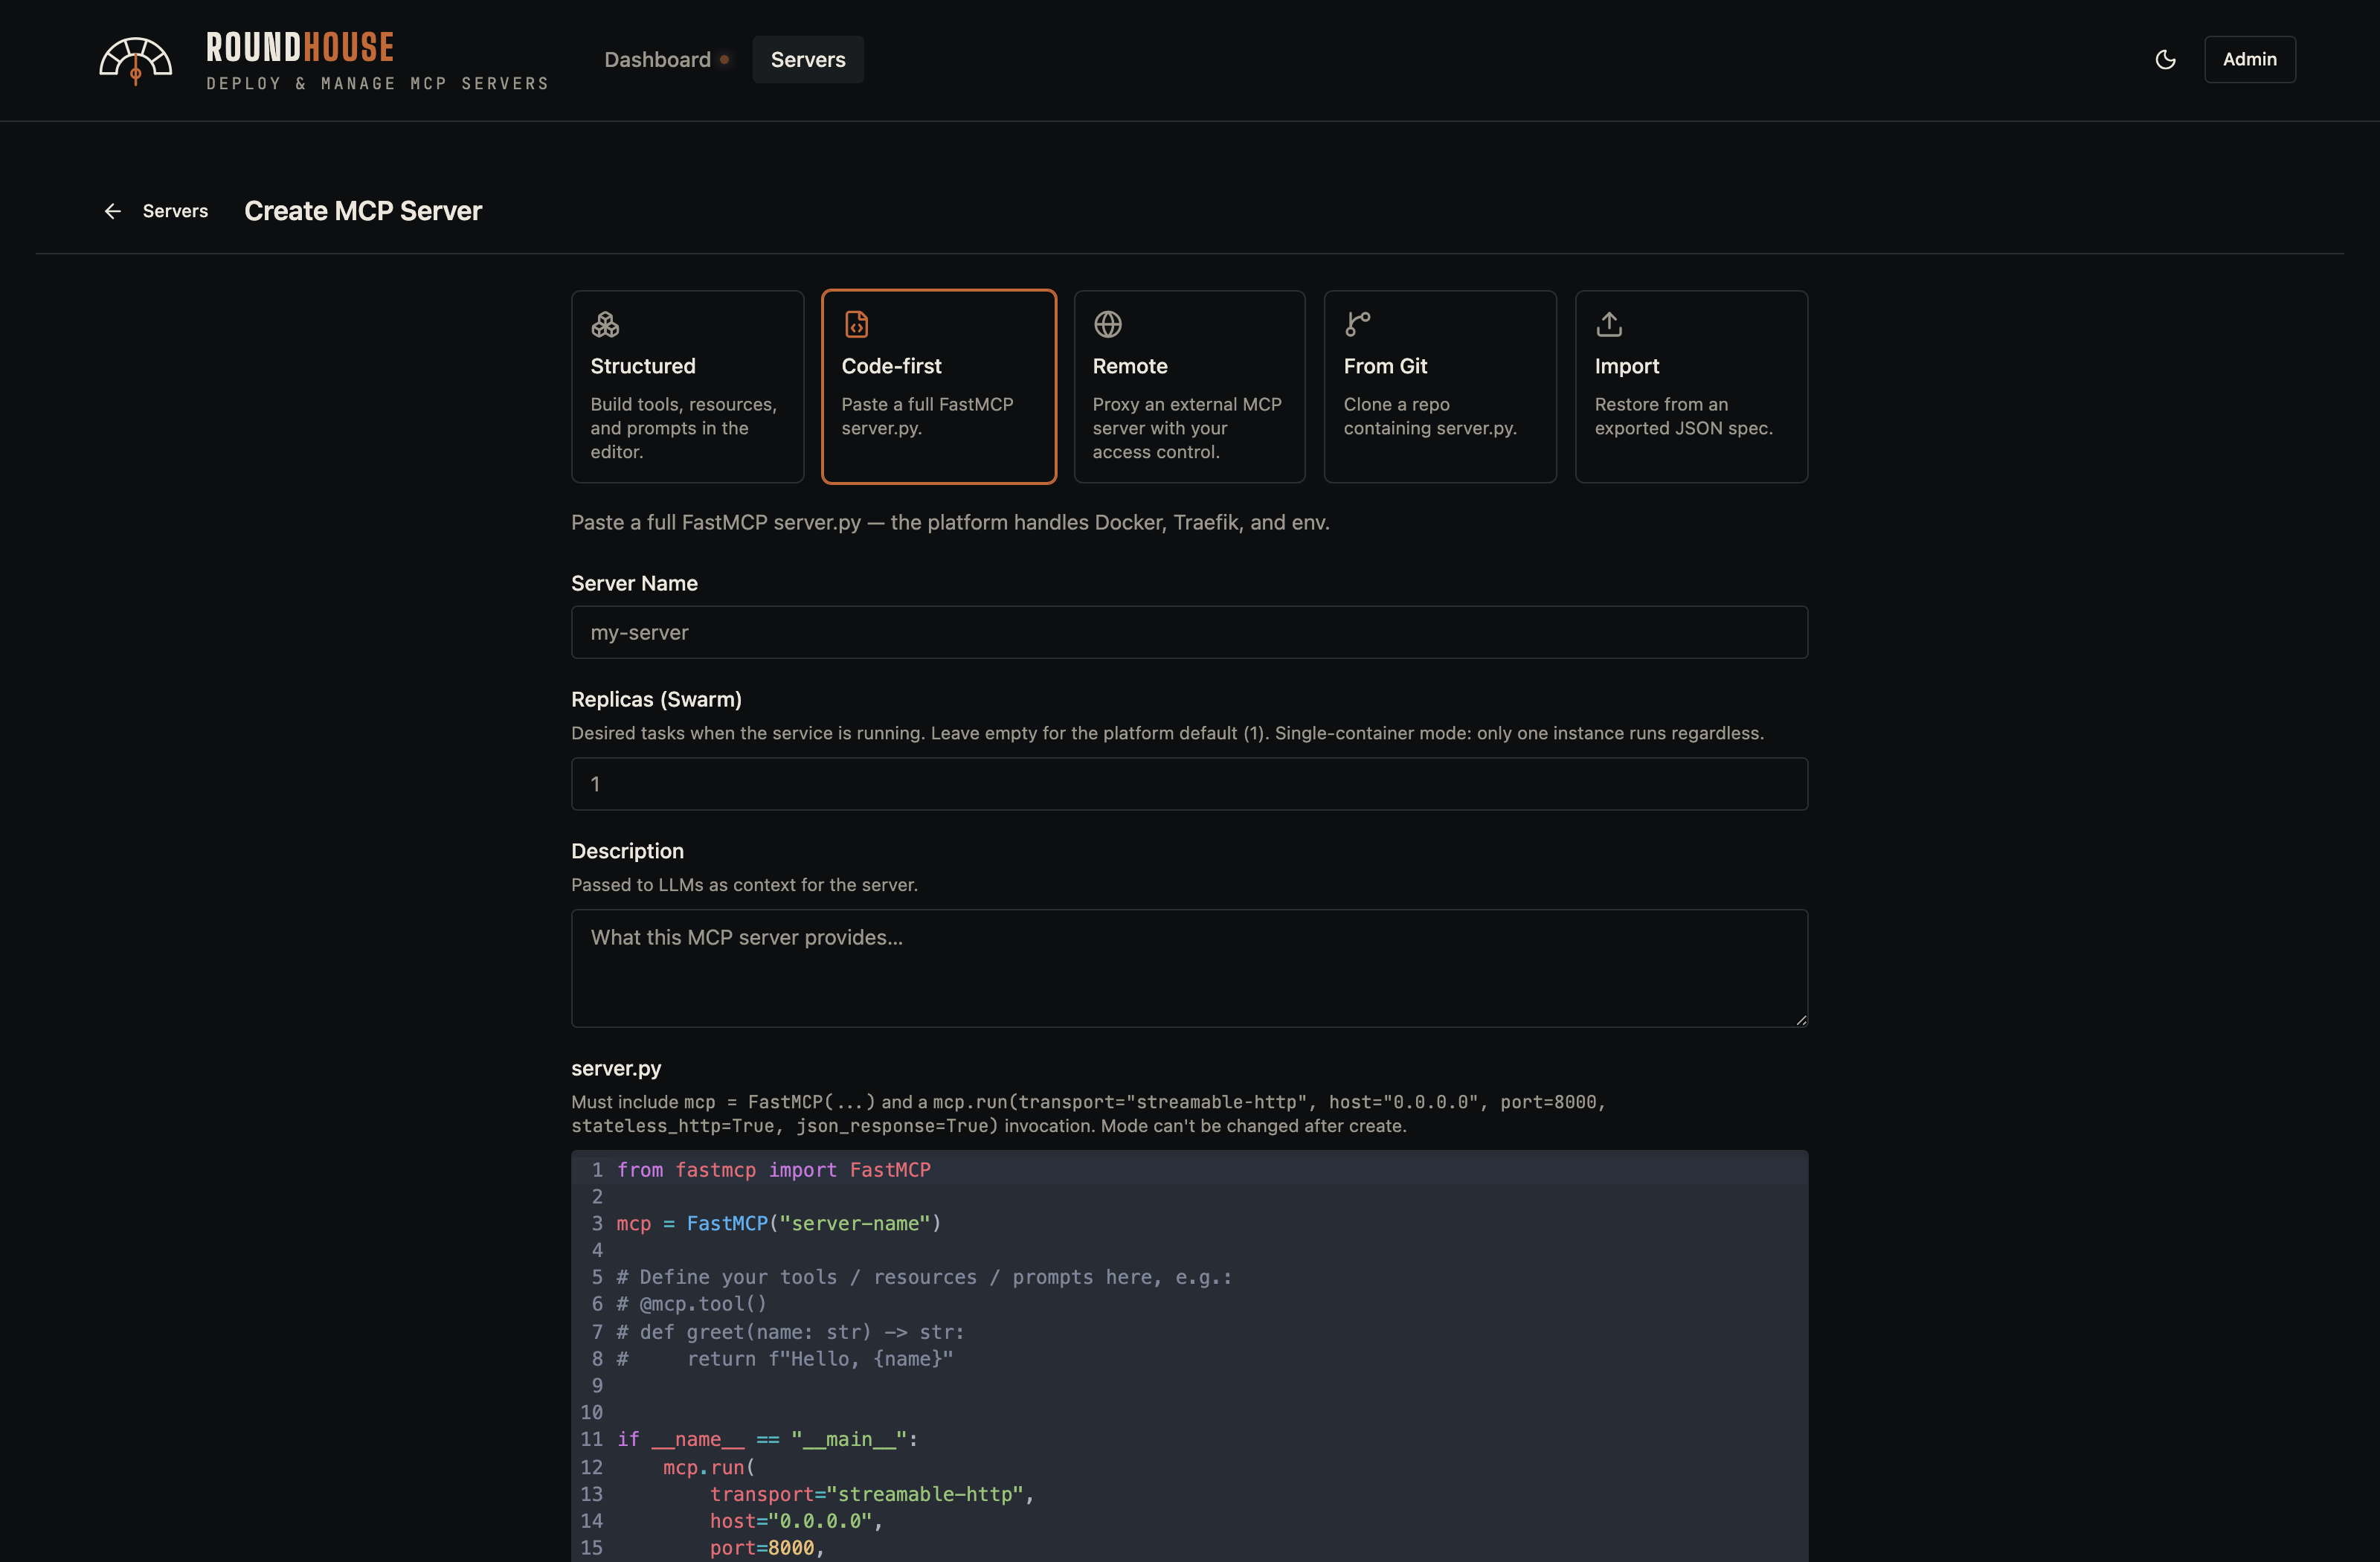
The Create button opens a dialog with a tab for each way a server can be authored.
Structured#
The default: an empty spec-managed server. Primitives, packages, env vars, and middleware are managed through the UI; Roundhouse owns the Dockerfile.
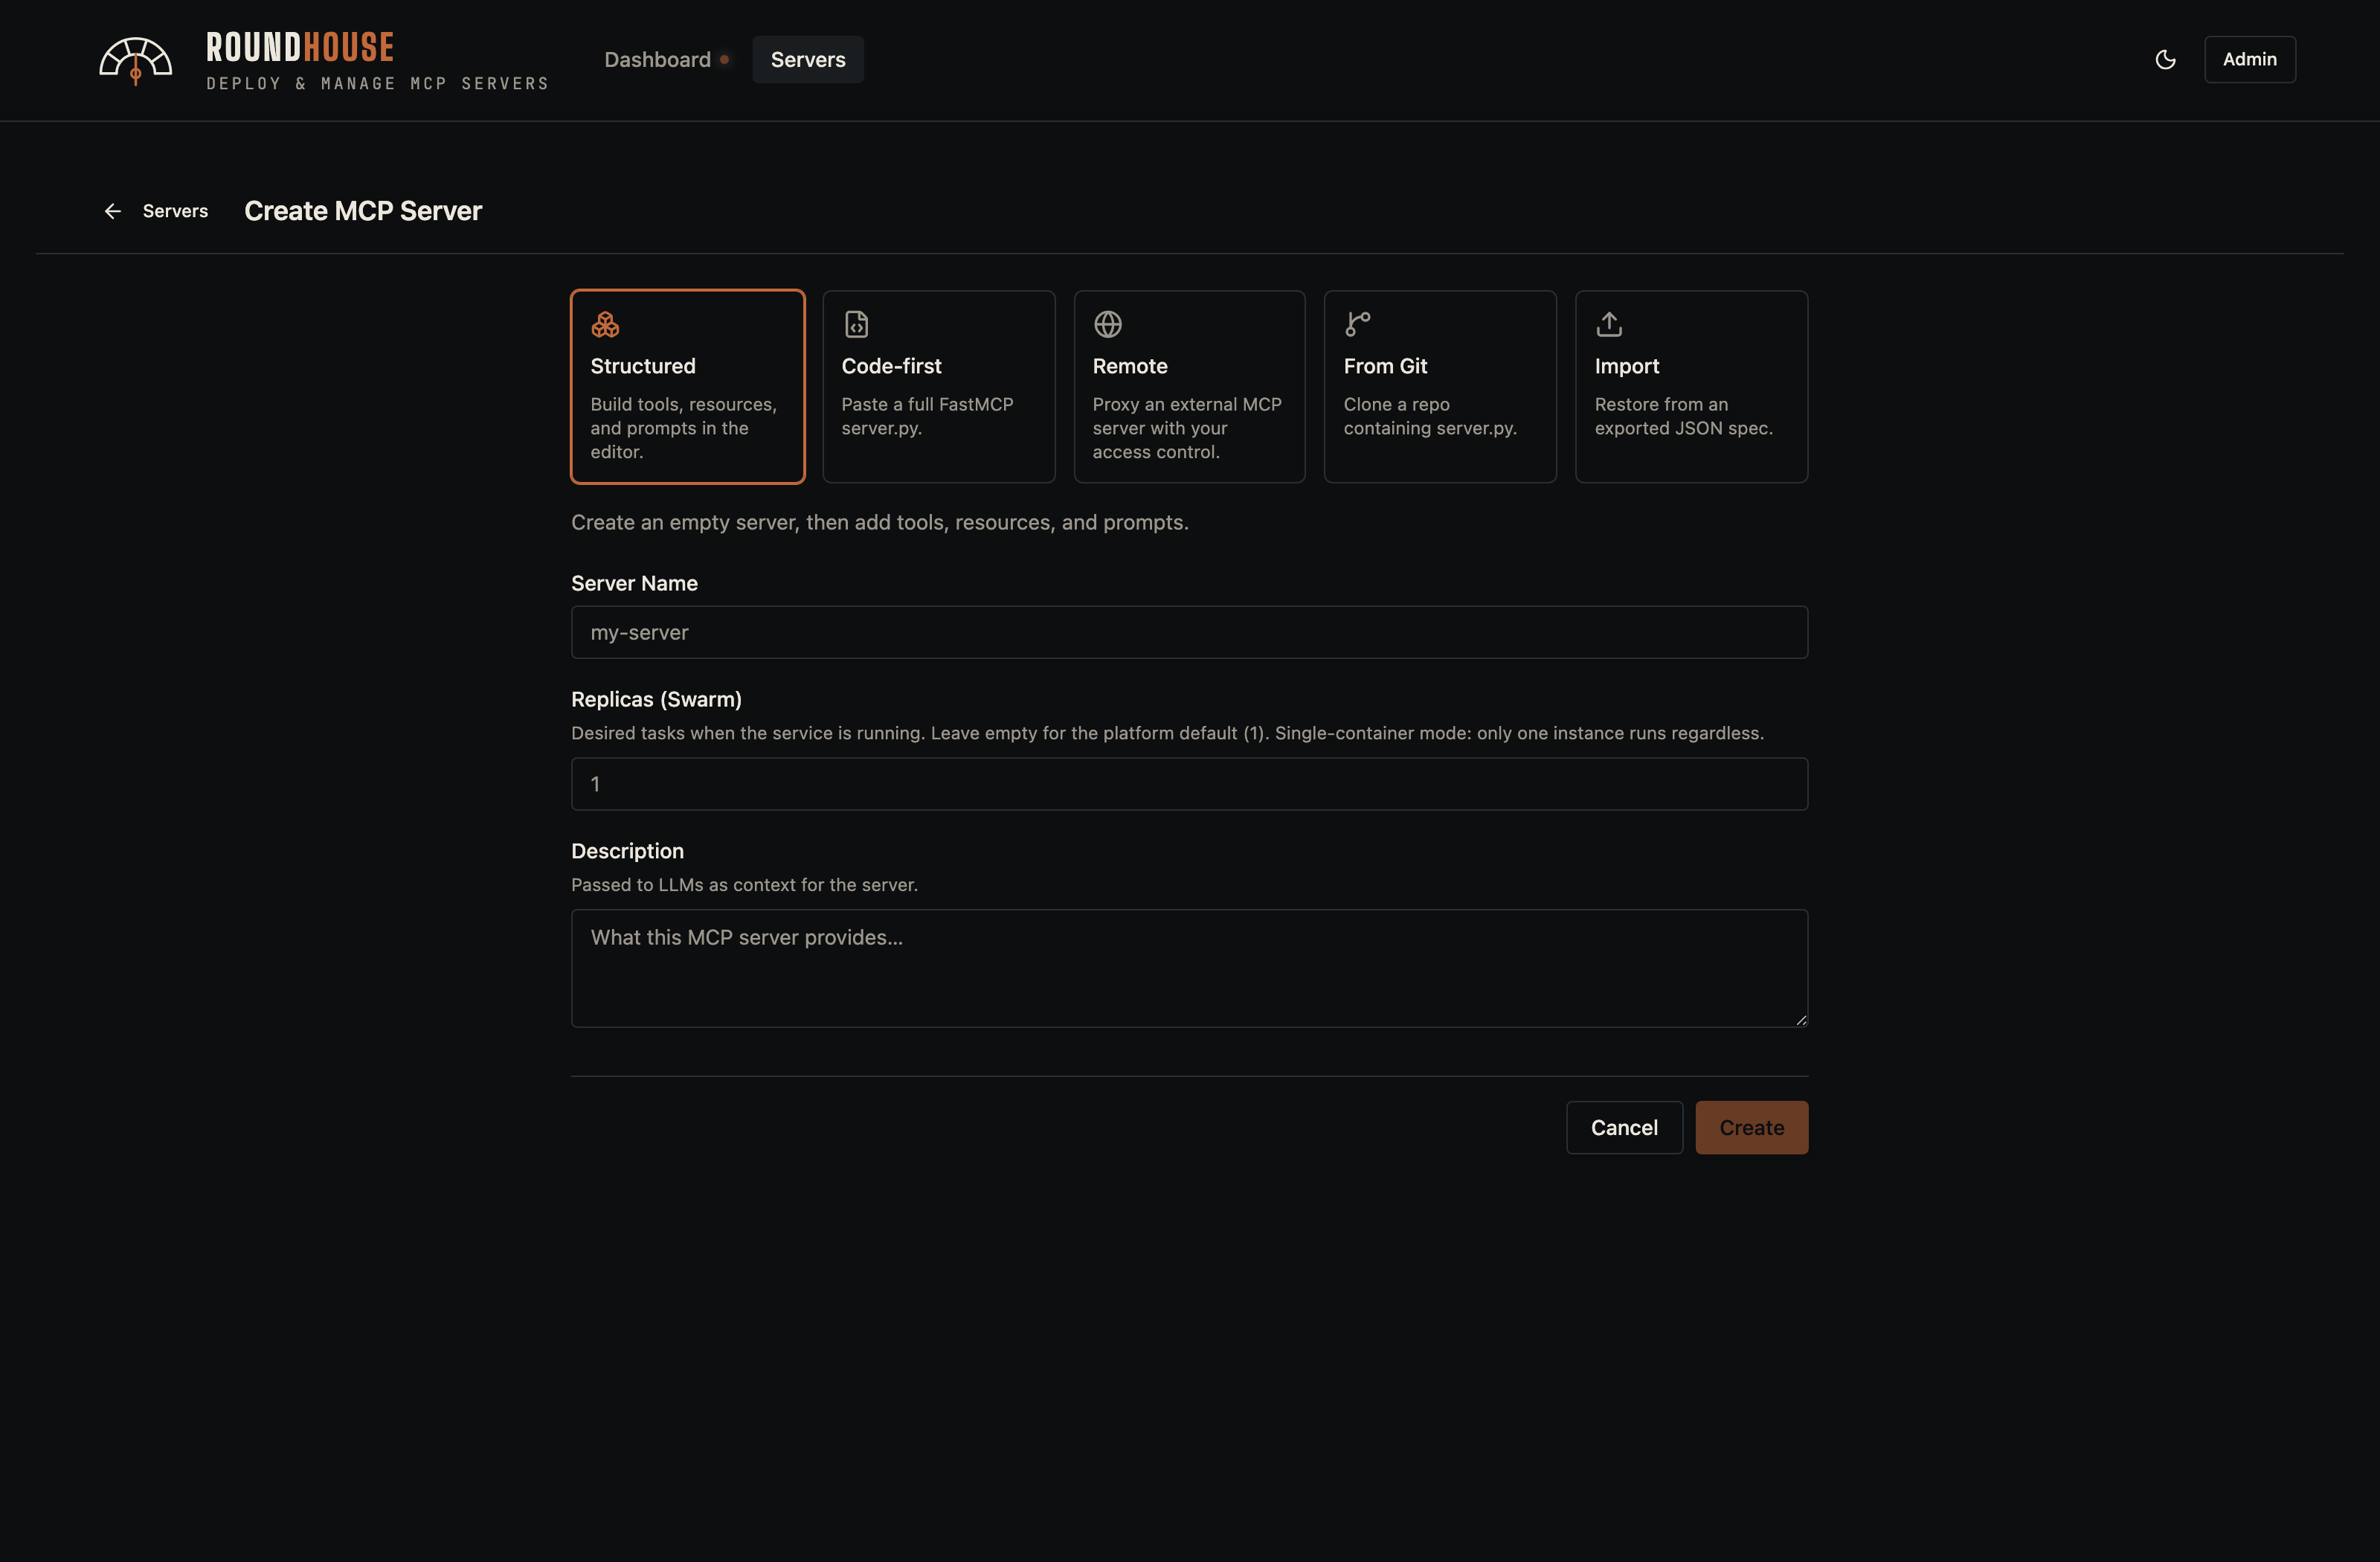
Code-first#
You supply a complete server.py (FastMCP). Roundhouse still owns the Dockerfile and platform middleware, but the primitive surface is hidden in favour of a full source editor.
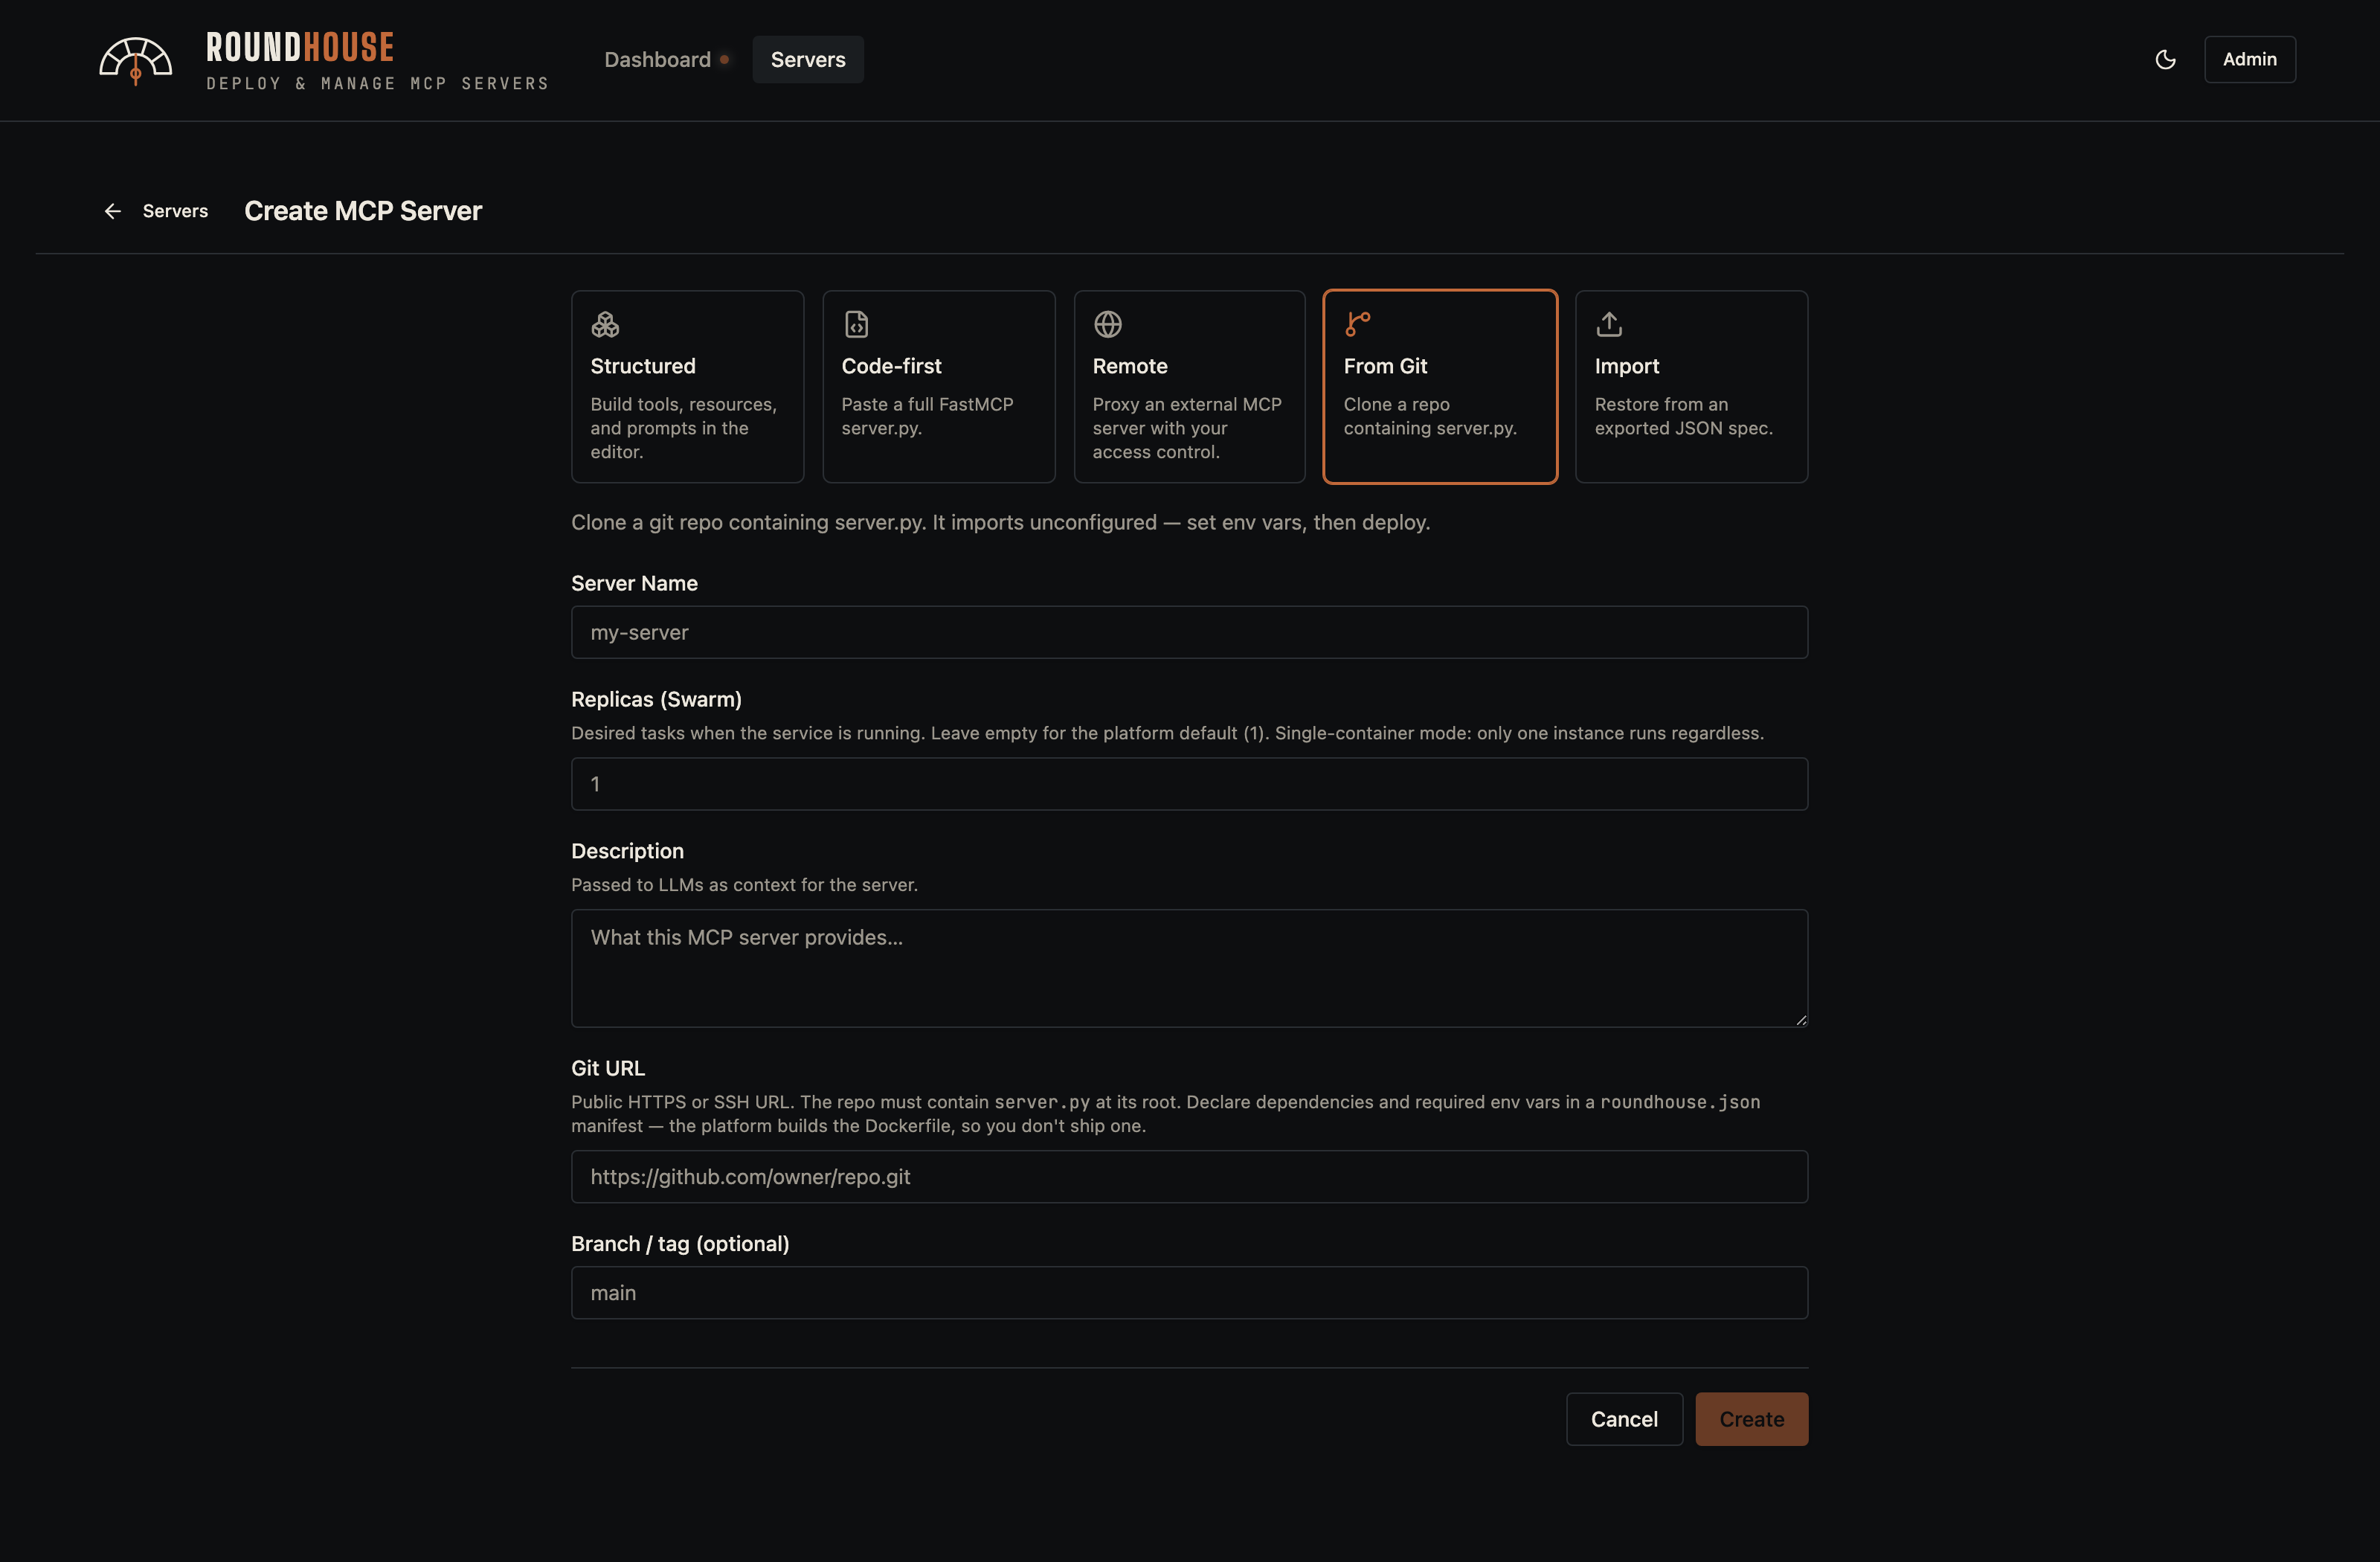
From Git#
Clone a repo that declares its dependencies in roundhouse.json. The imported server registers as not_deployed — Roundhouse seeds the environment variables declared by the manifest, populates pip and apt packages, and waits for an operator to fill in secrets before the first deploy.
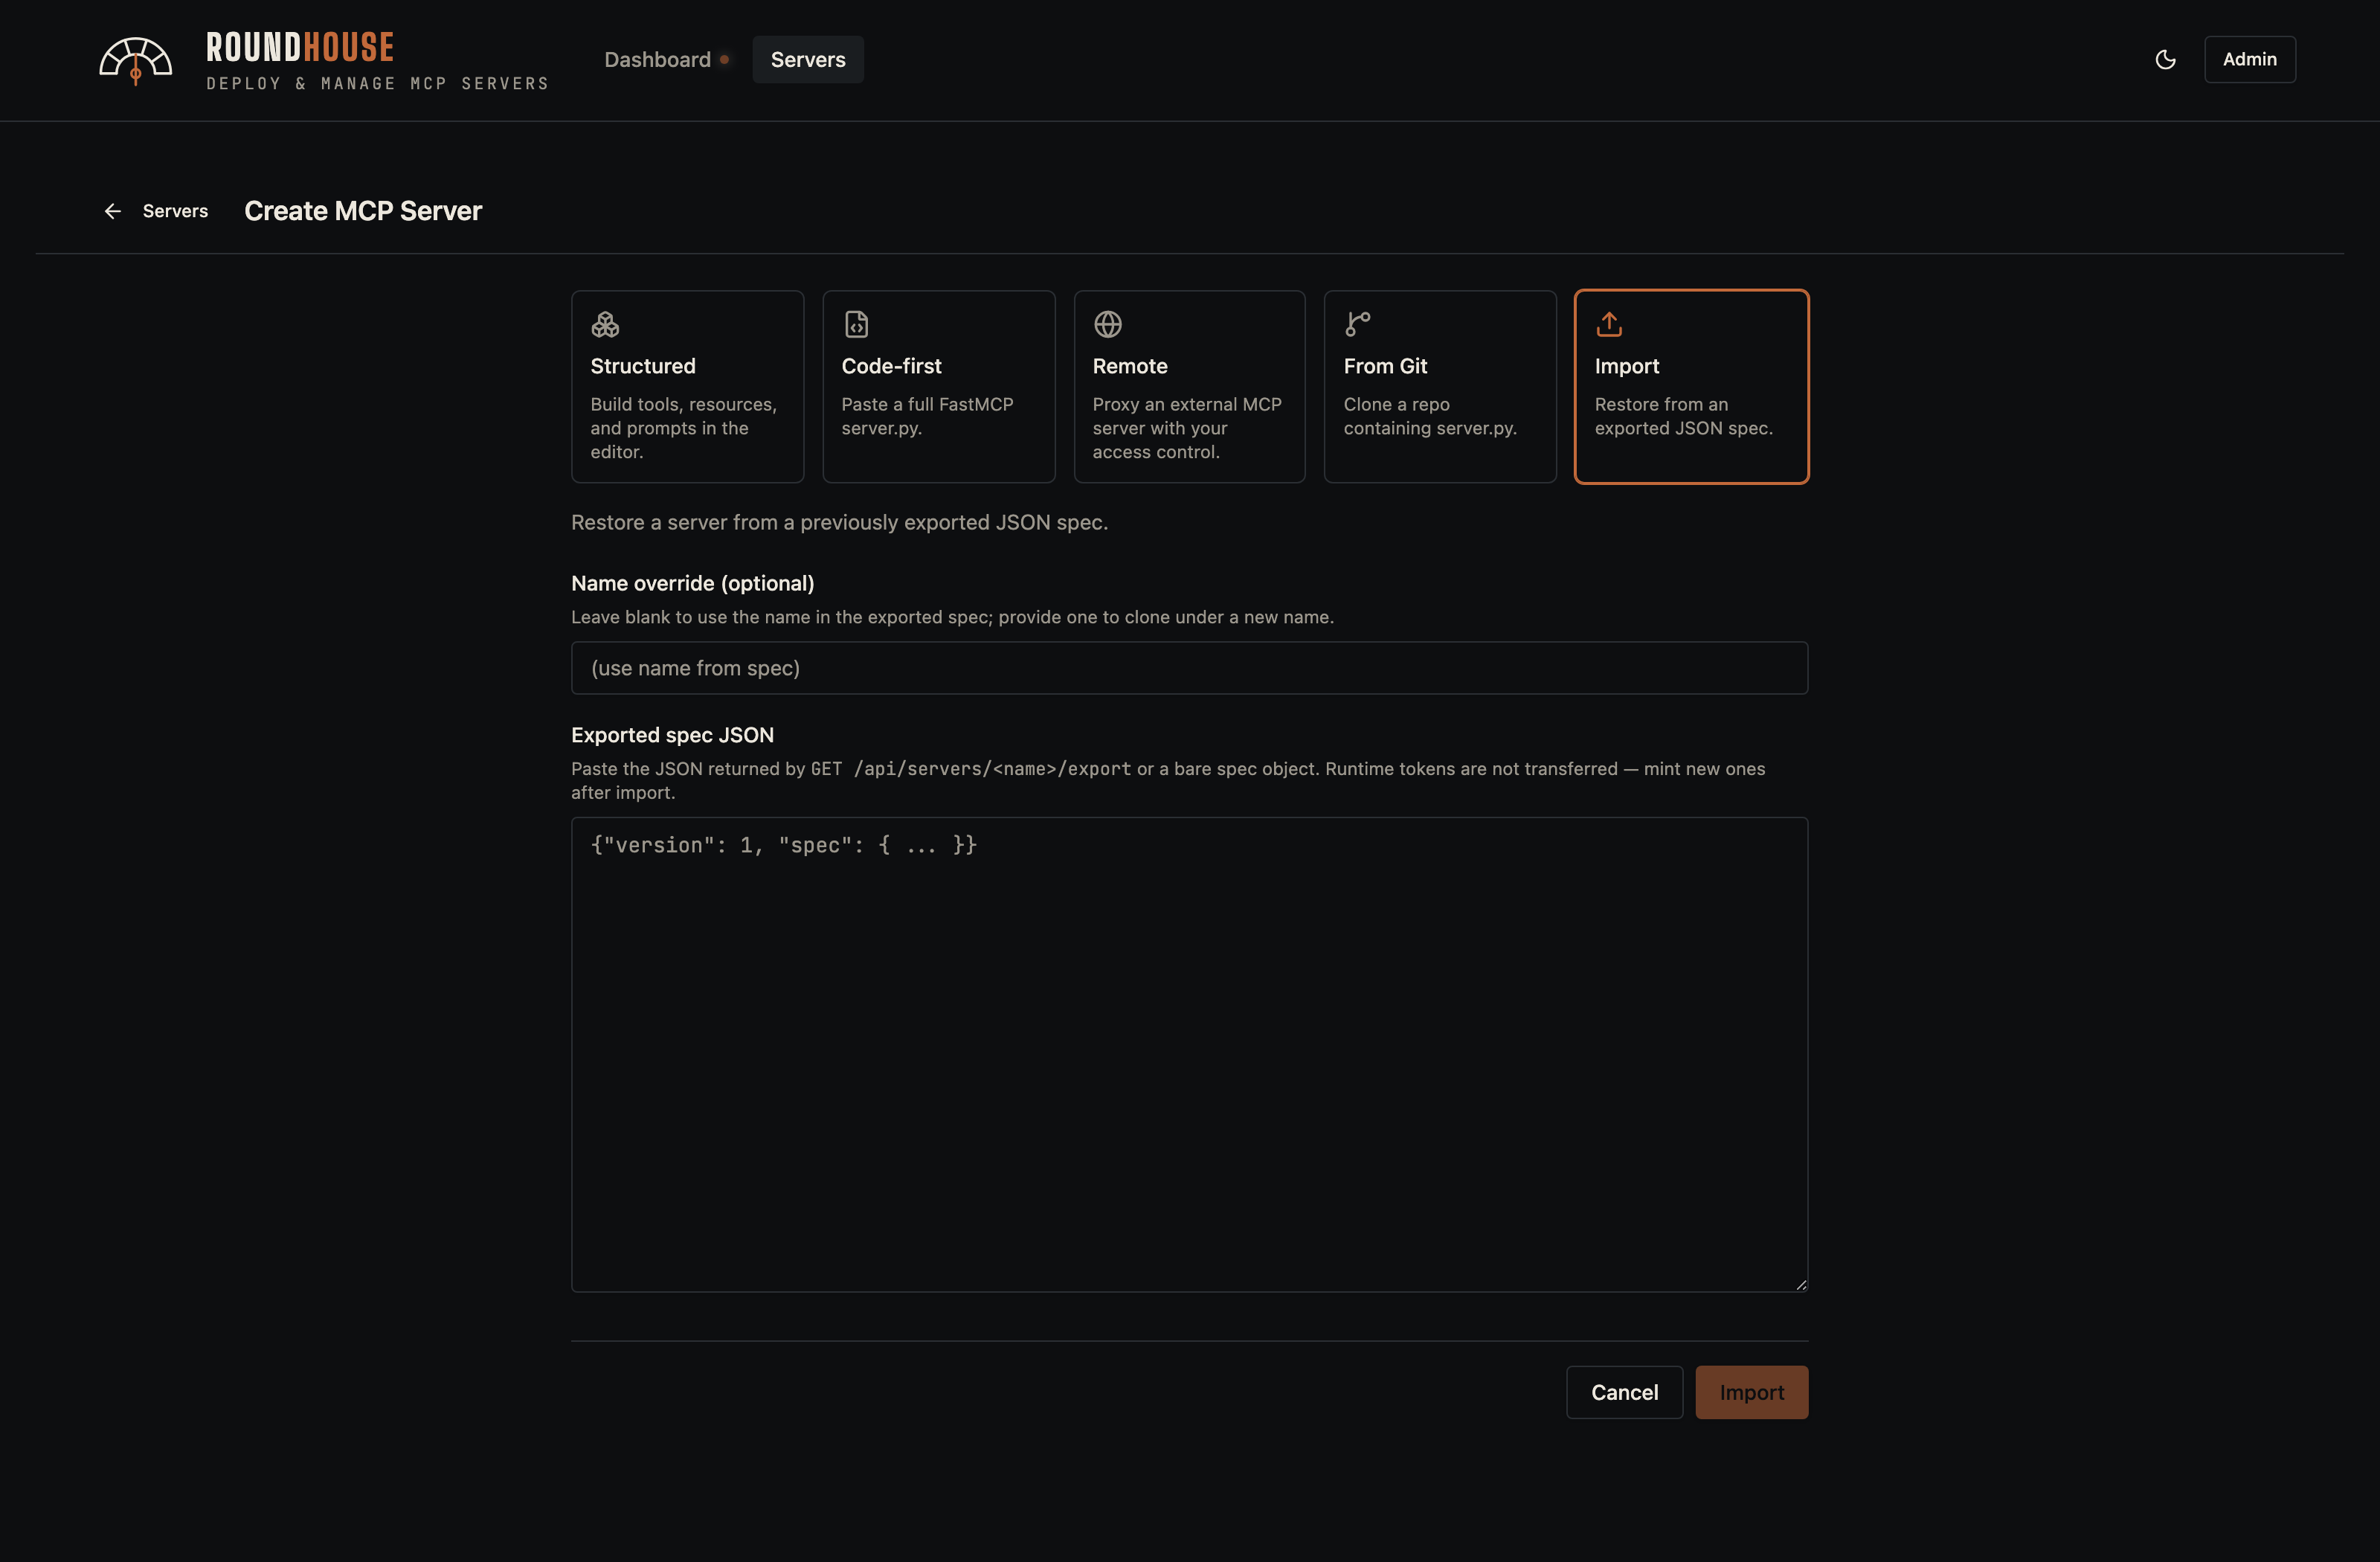
Import#
Paste an exported spec JSON (from another Roundhouse instance, or from POST /api/servers/{name}/export) to clone a server's configuration verbatim.
The server editor#
Selecting a server opens the two-pane editor. The left rail is the server's table of contents — primitives, configuration, and operational tabs. The right pane is whichever section you've selected.
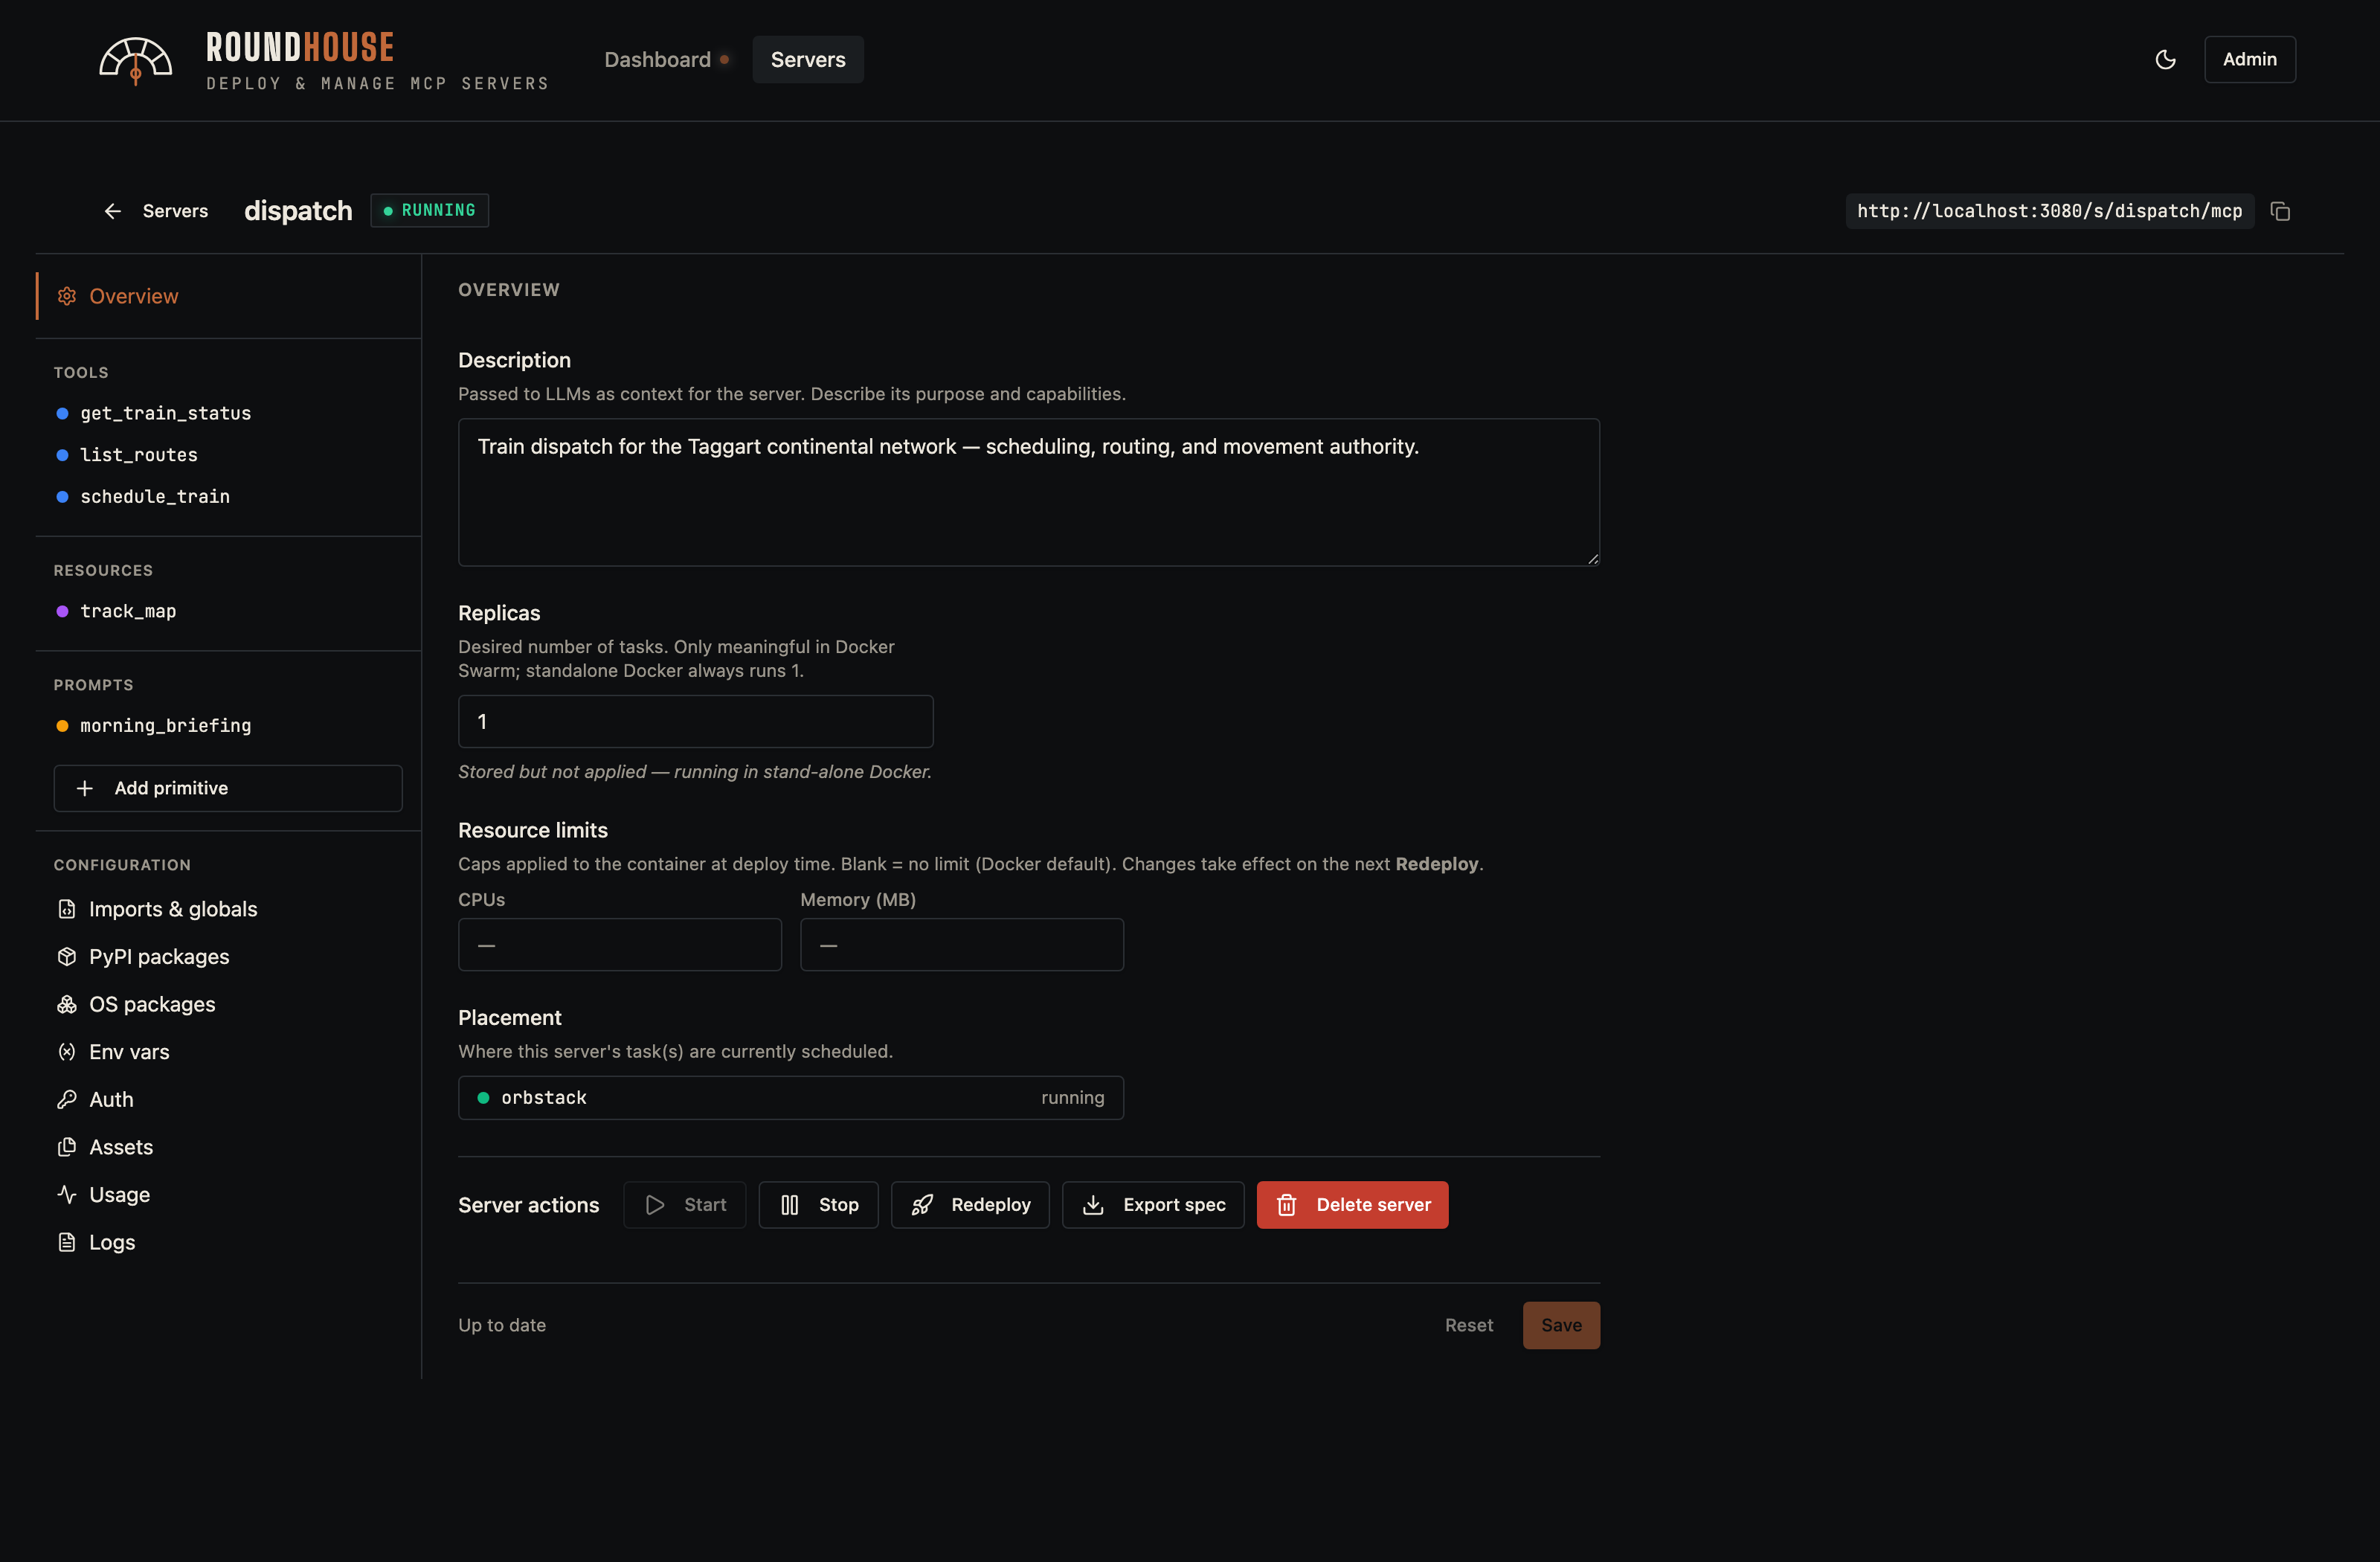
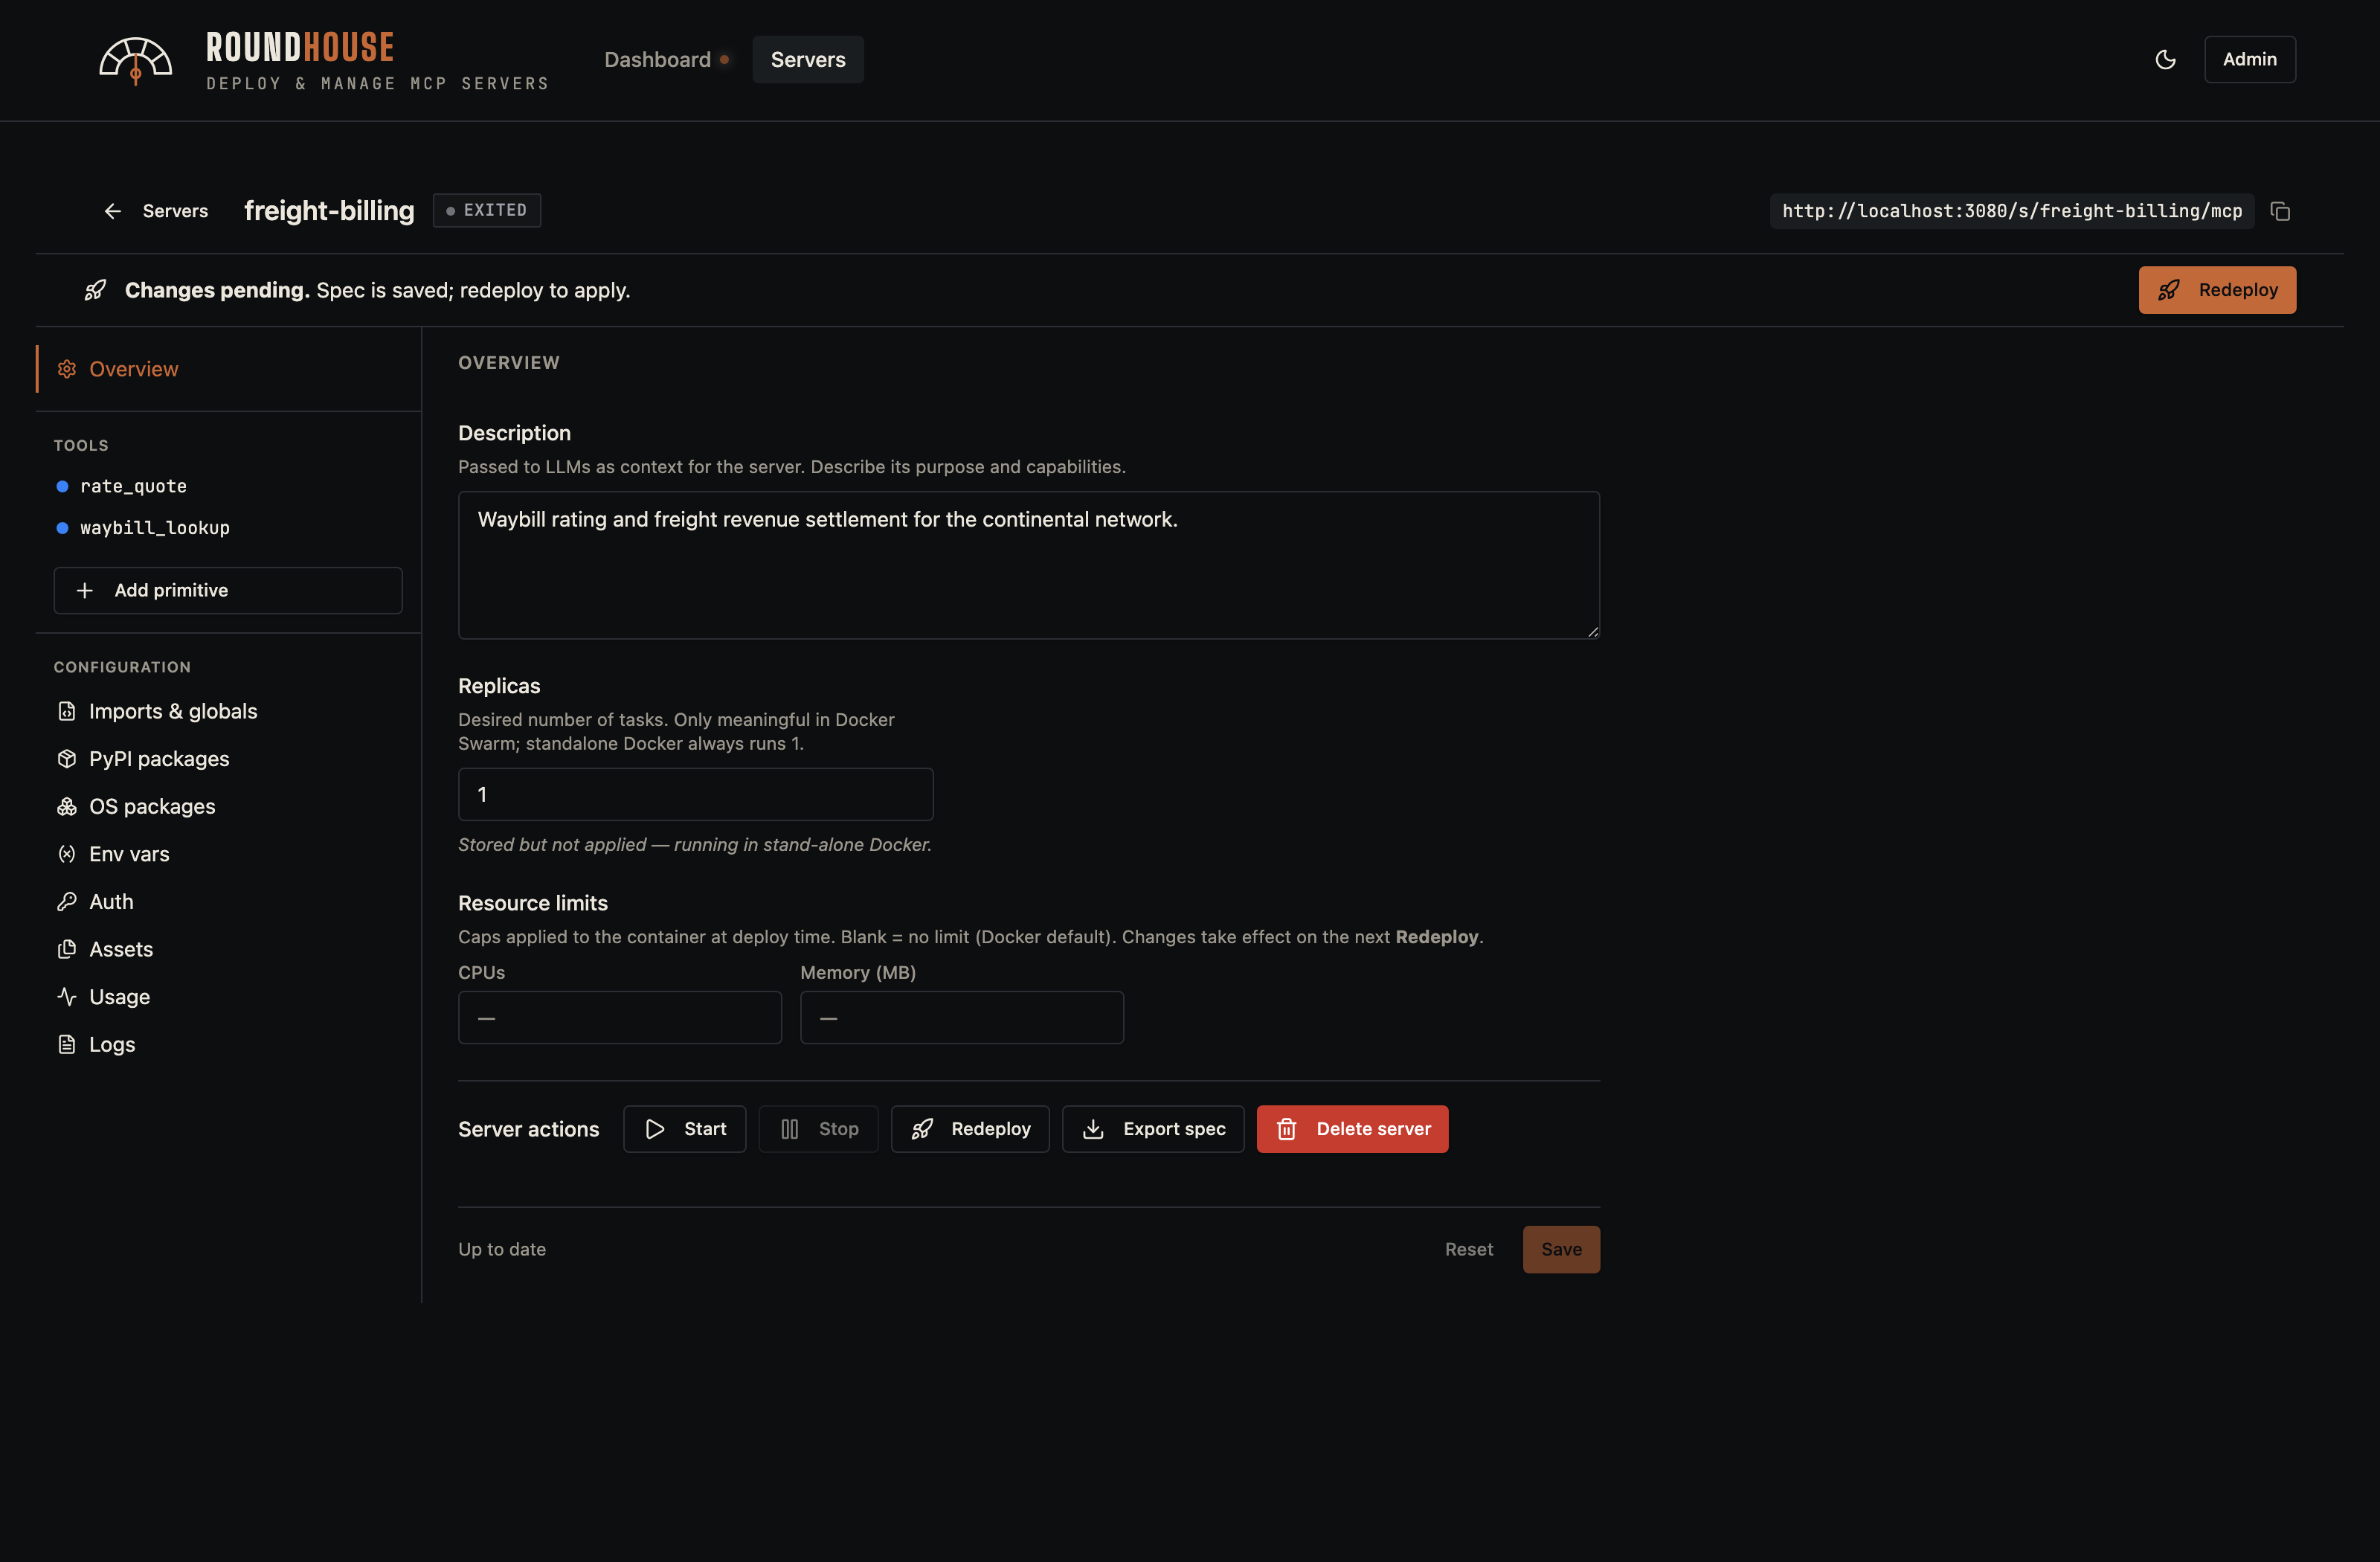
Overview#
The overview is the editor's home base: description, replicas, resource limits, and the lifecycle controls (Start, Stop, Redeploy, Delete, plus Update from Git for repos imported via from-git).
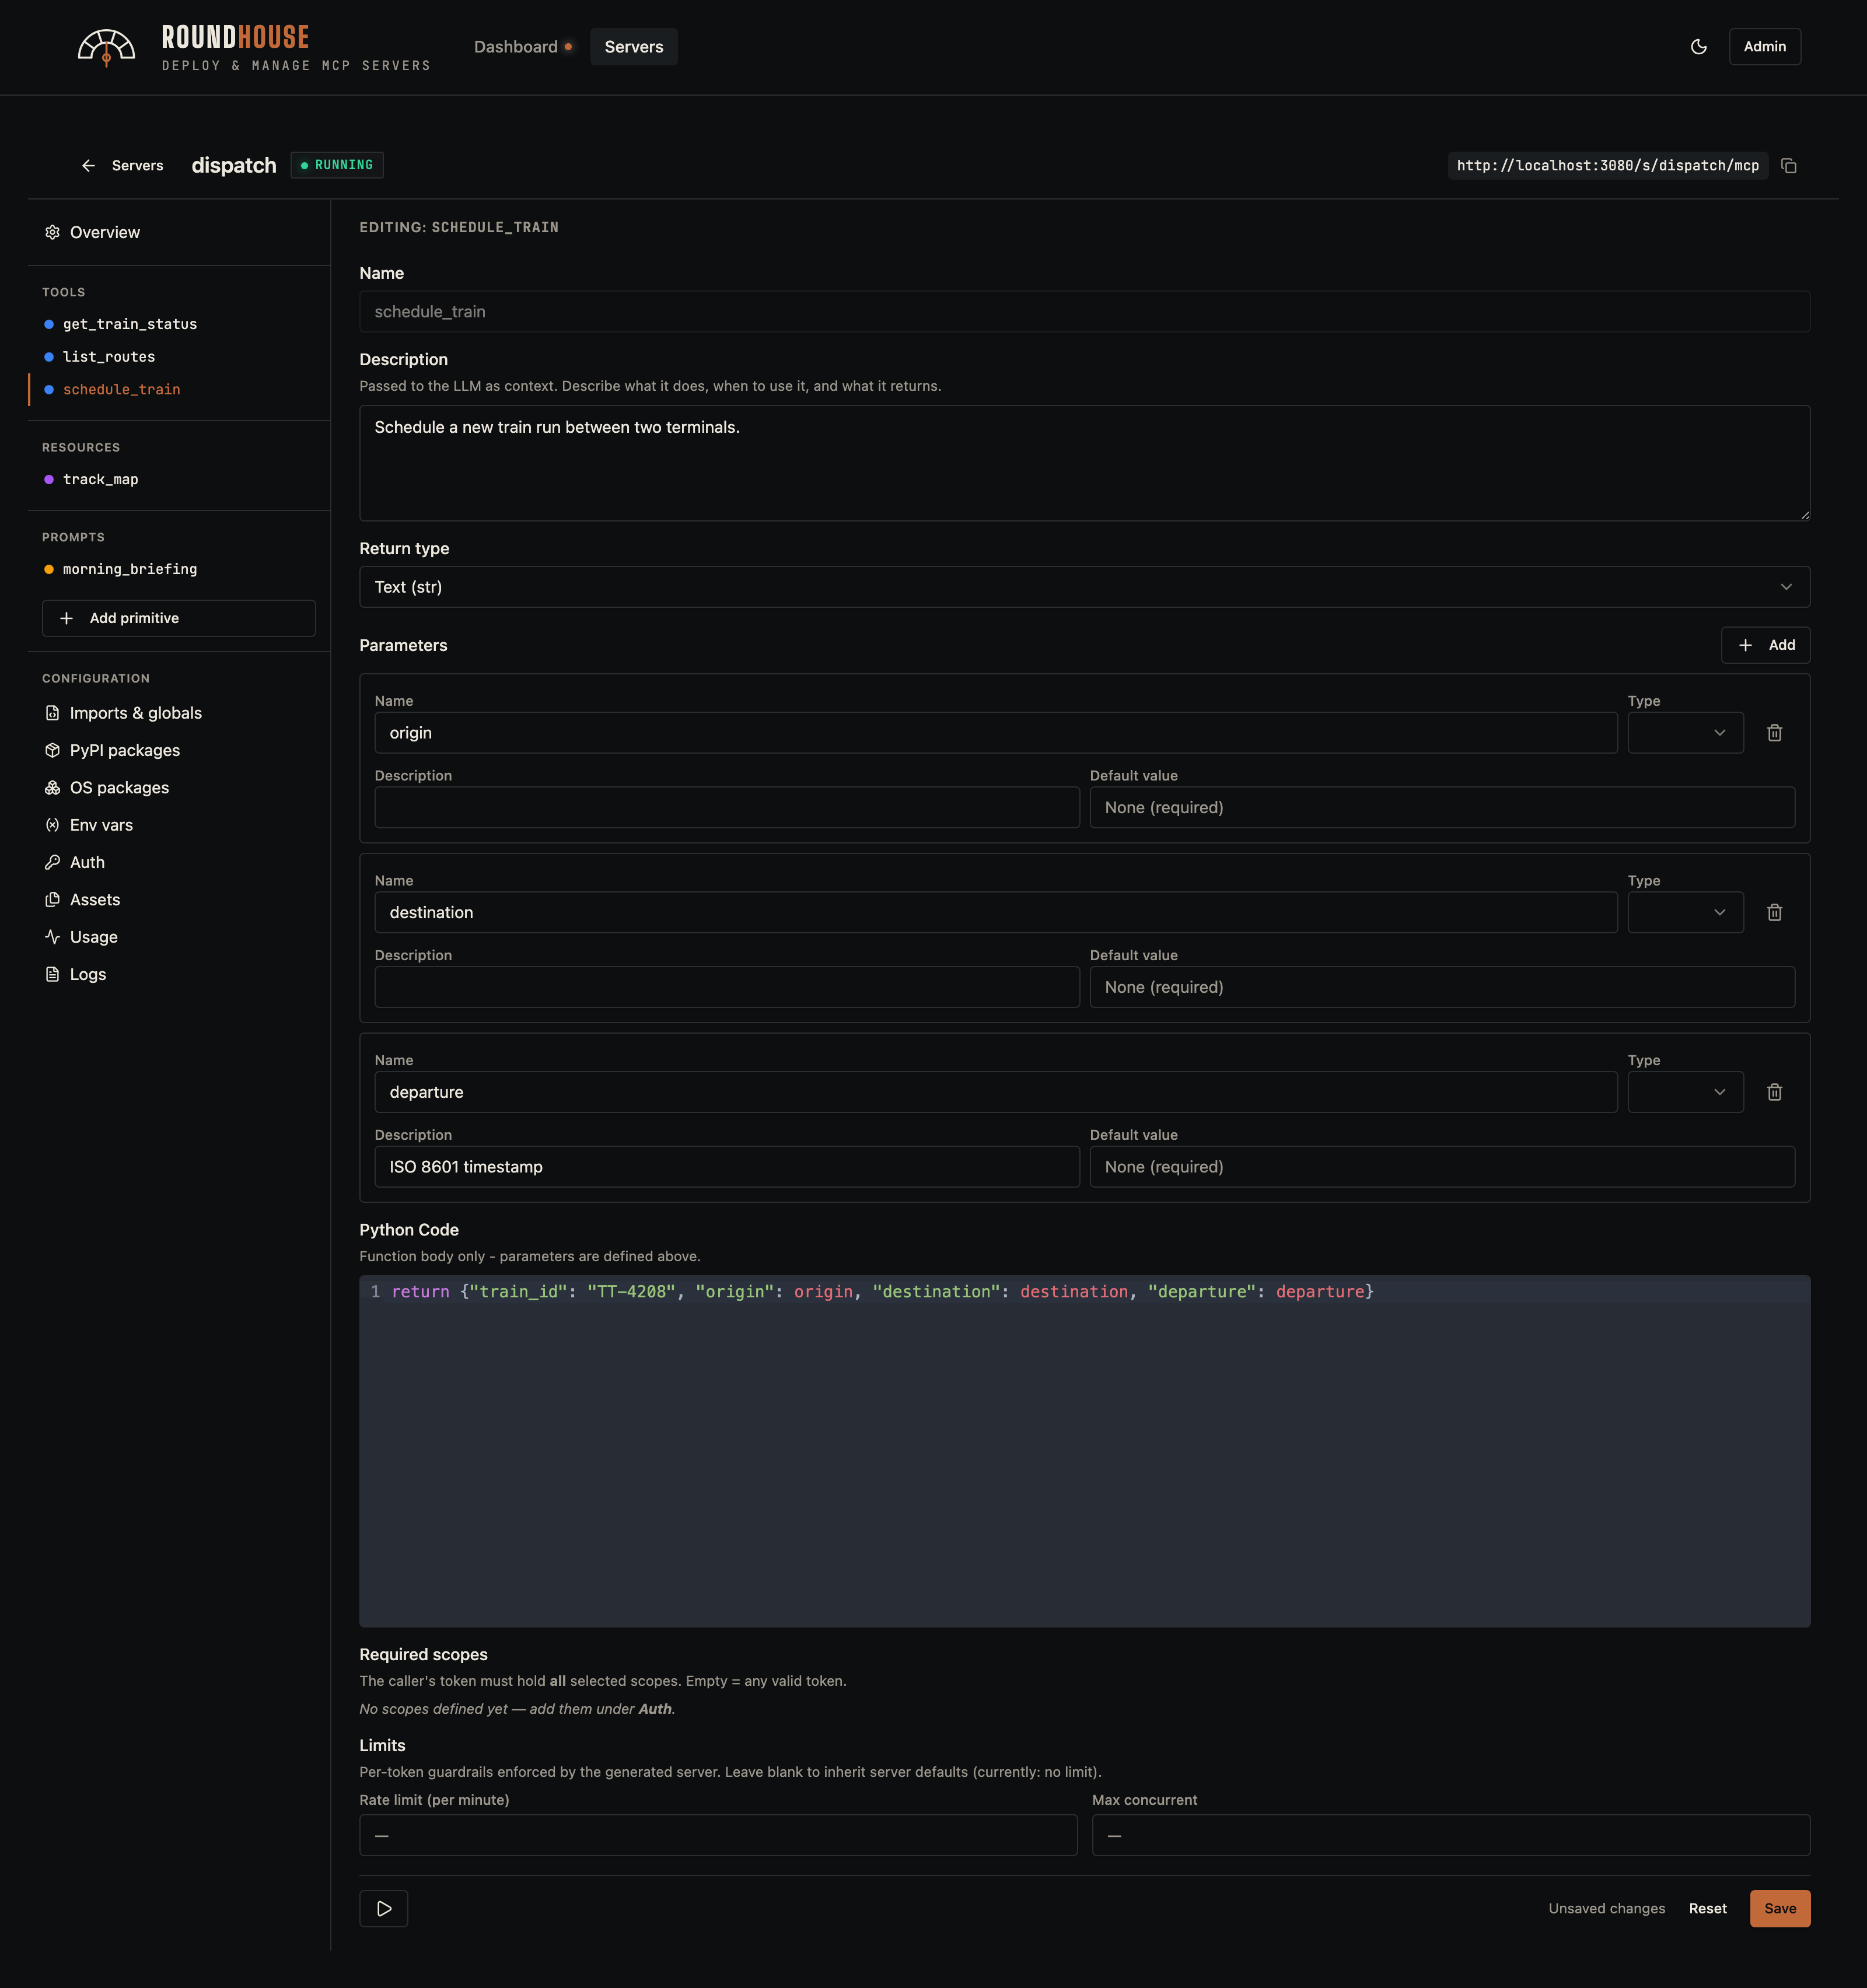
Primitives#
Structured servers expose tools, resources, resource templates, and prompts. Each primitive is edited in-place: parameters, body, and optional middleware overrides (rate limit, max concurrency).
Tool#
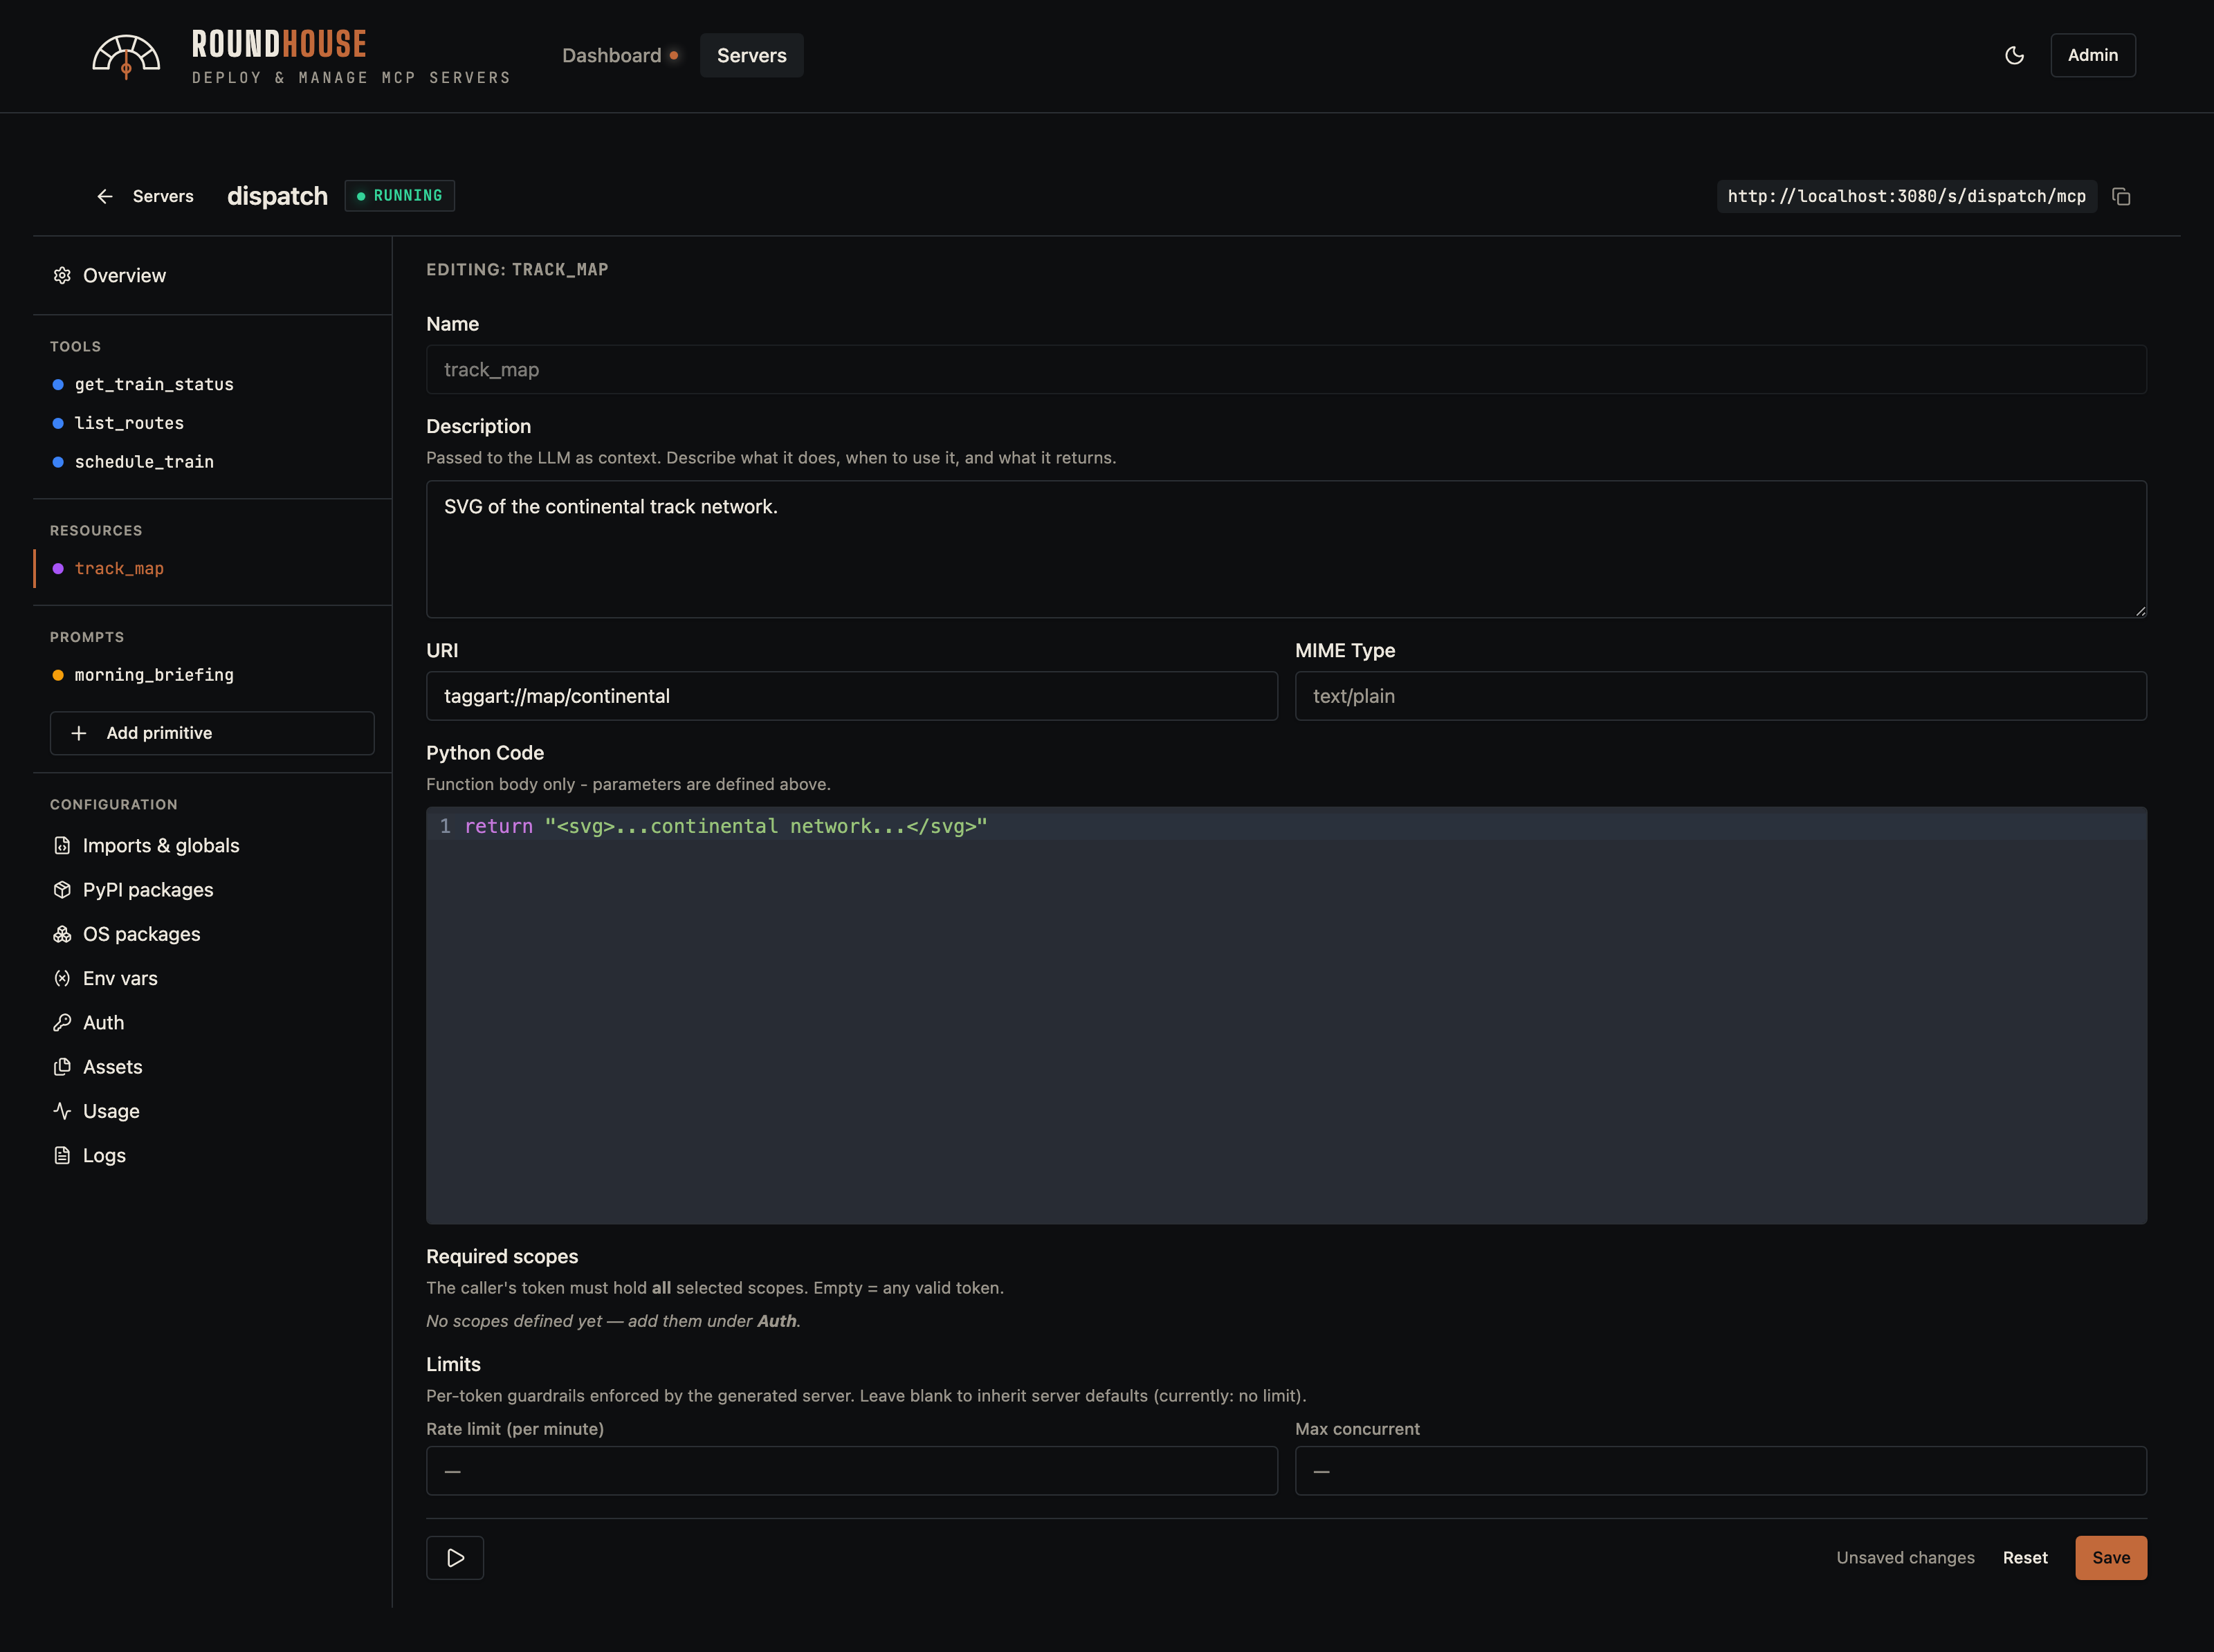
Resource#
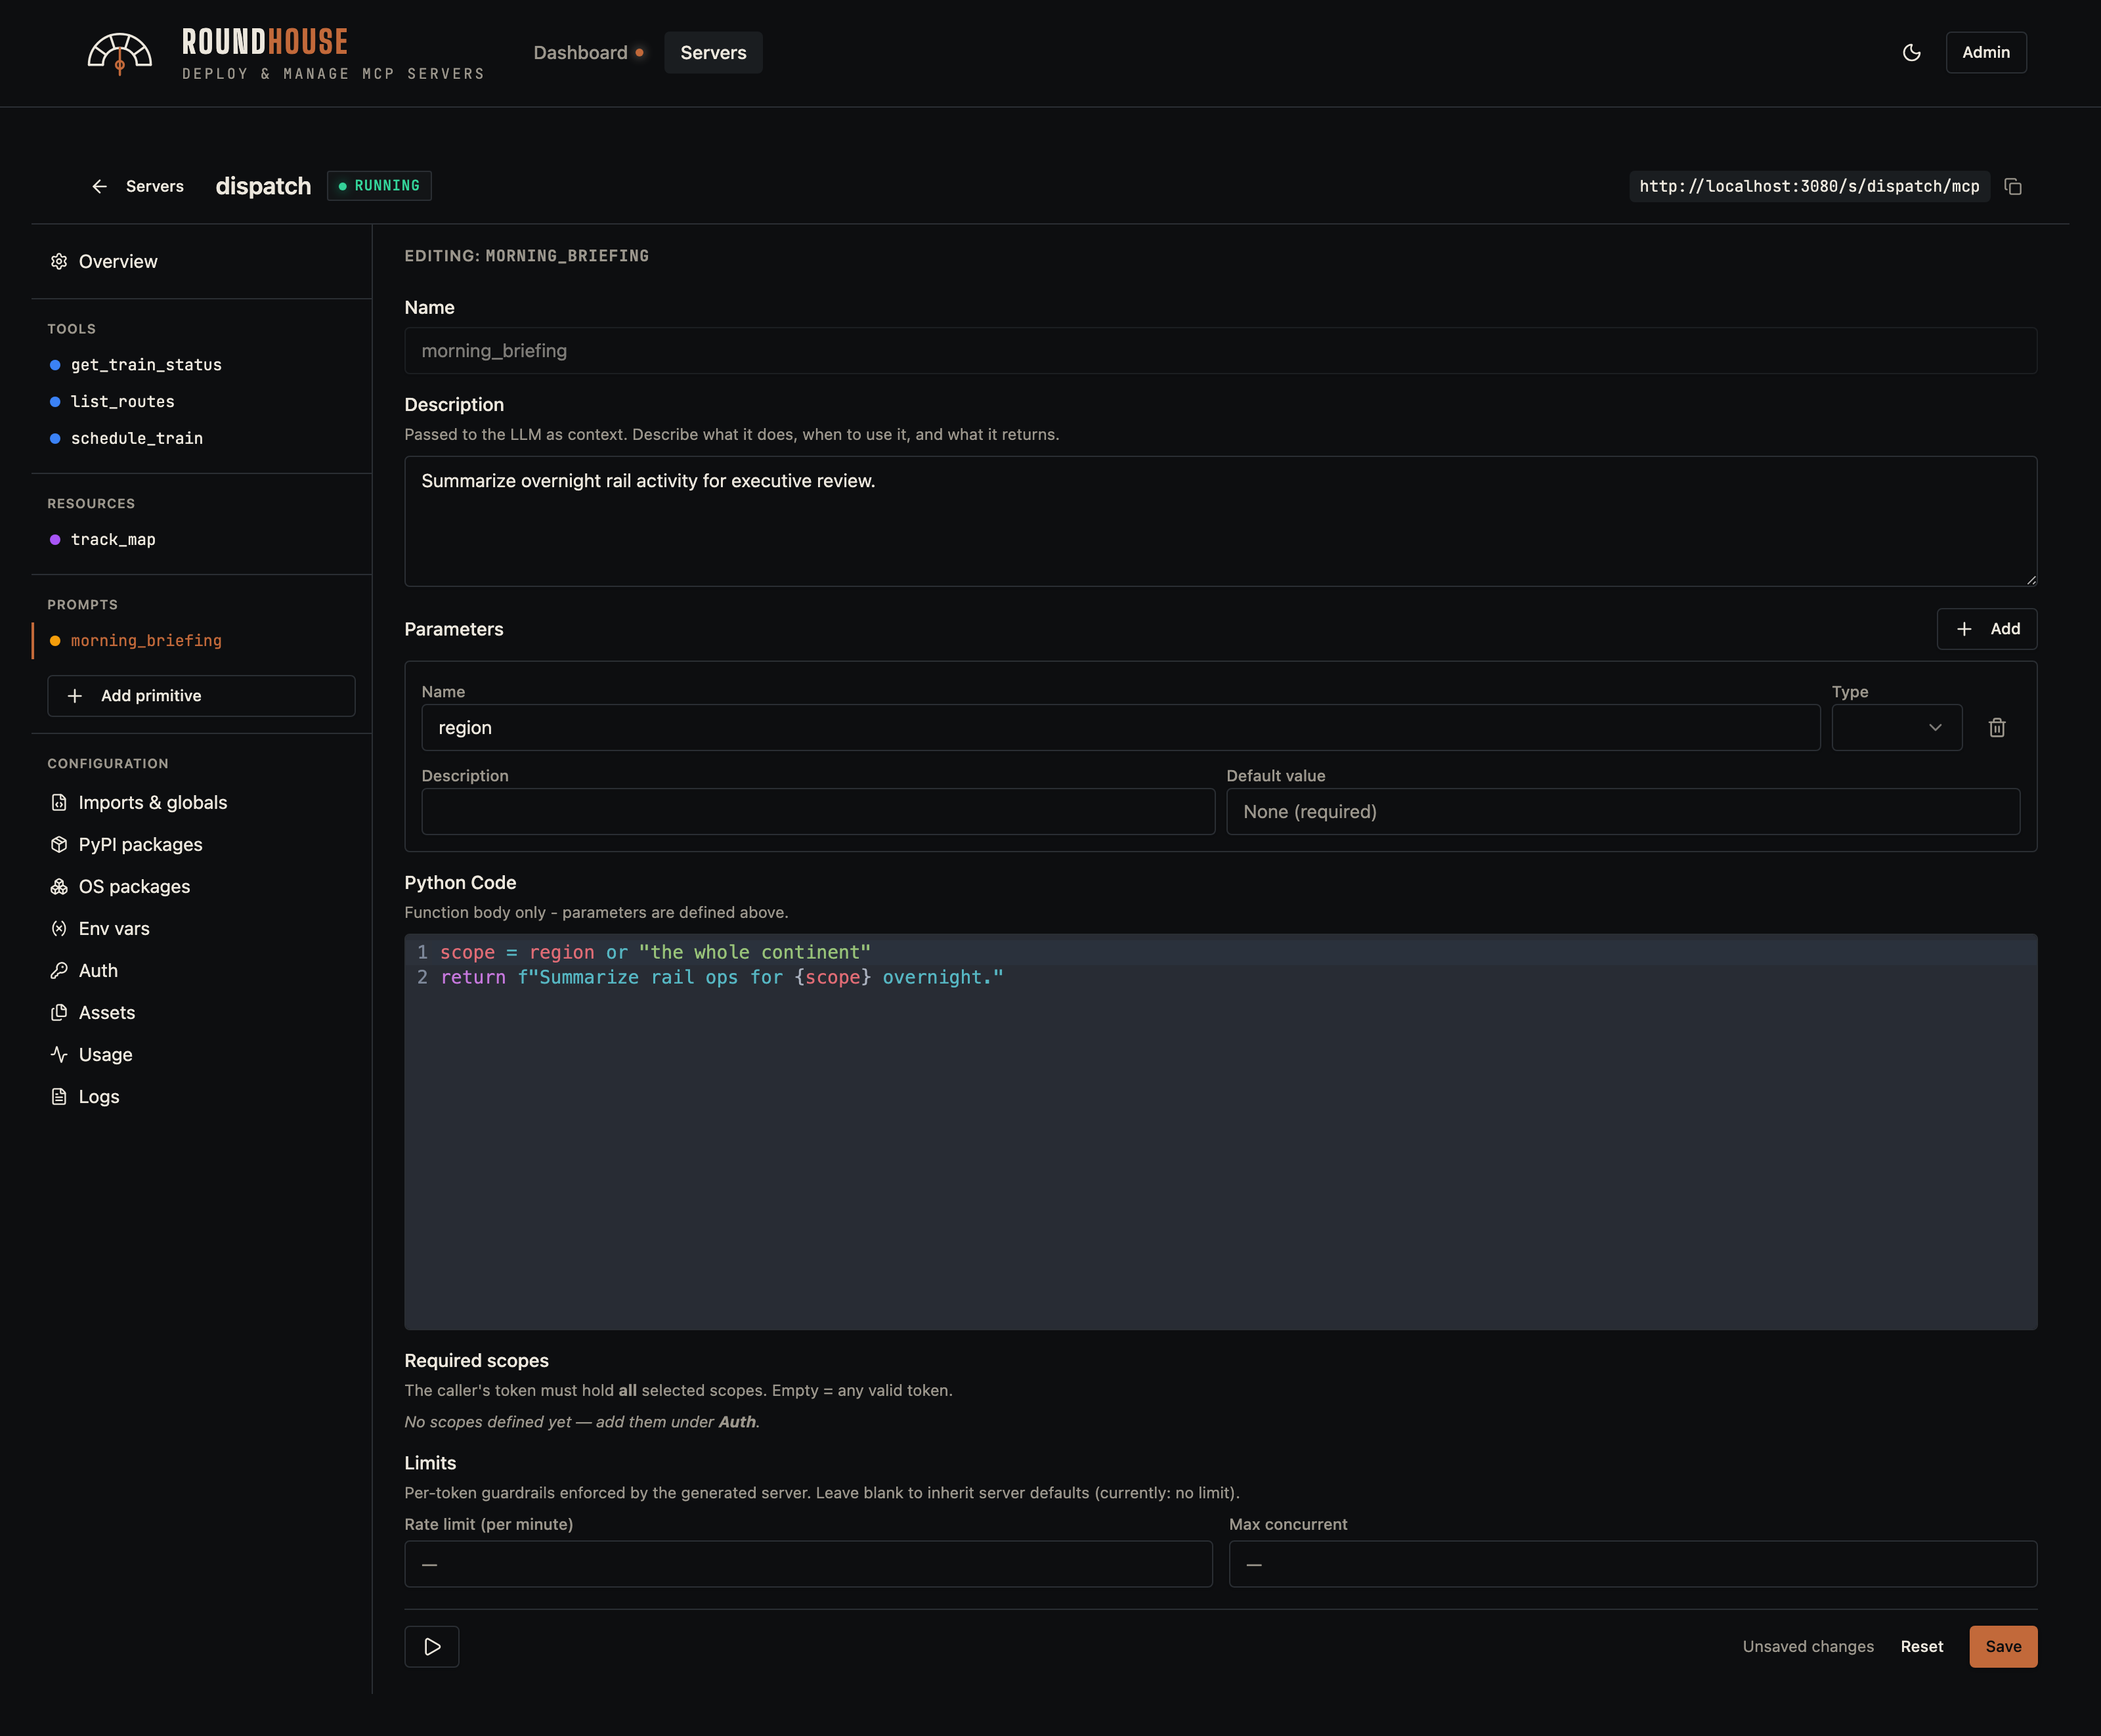
Prompt#
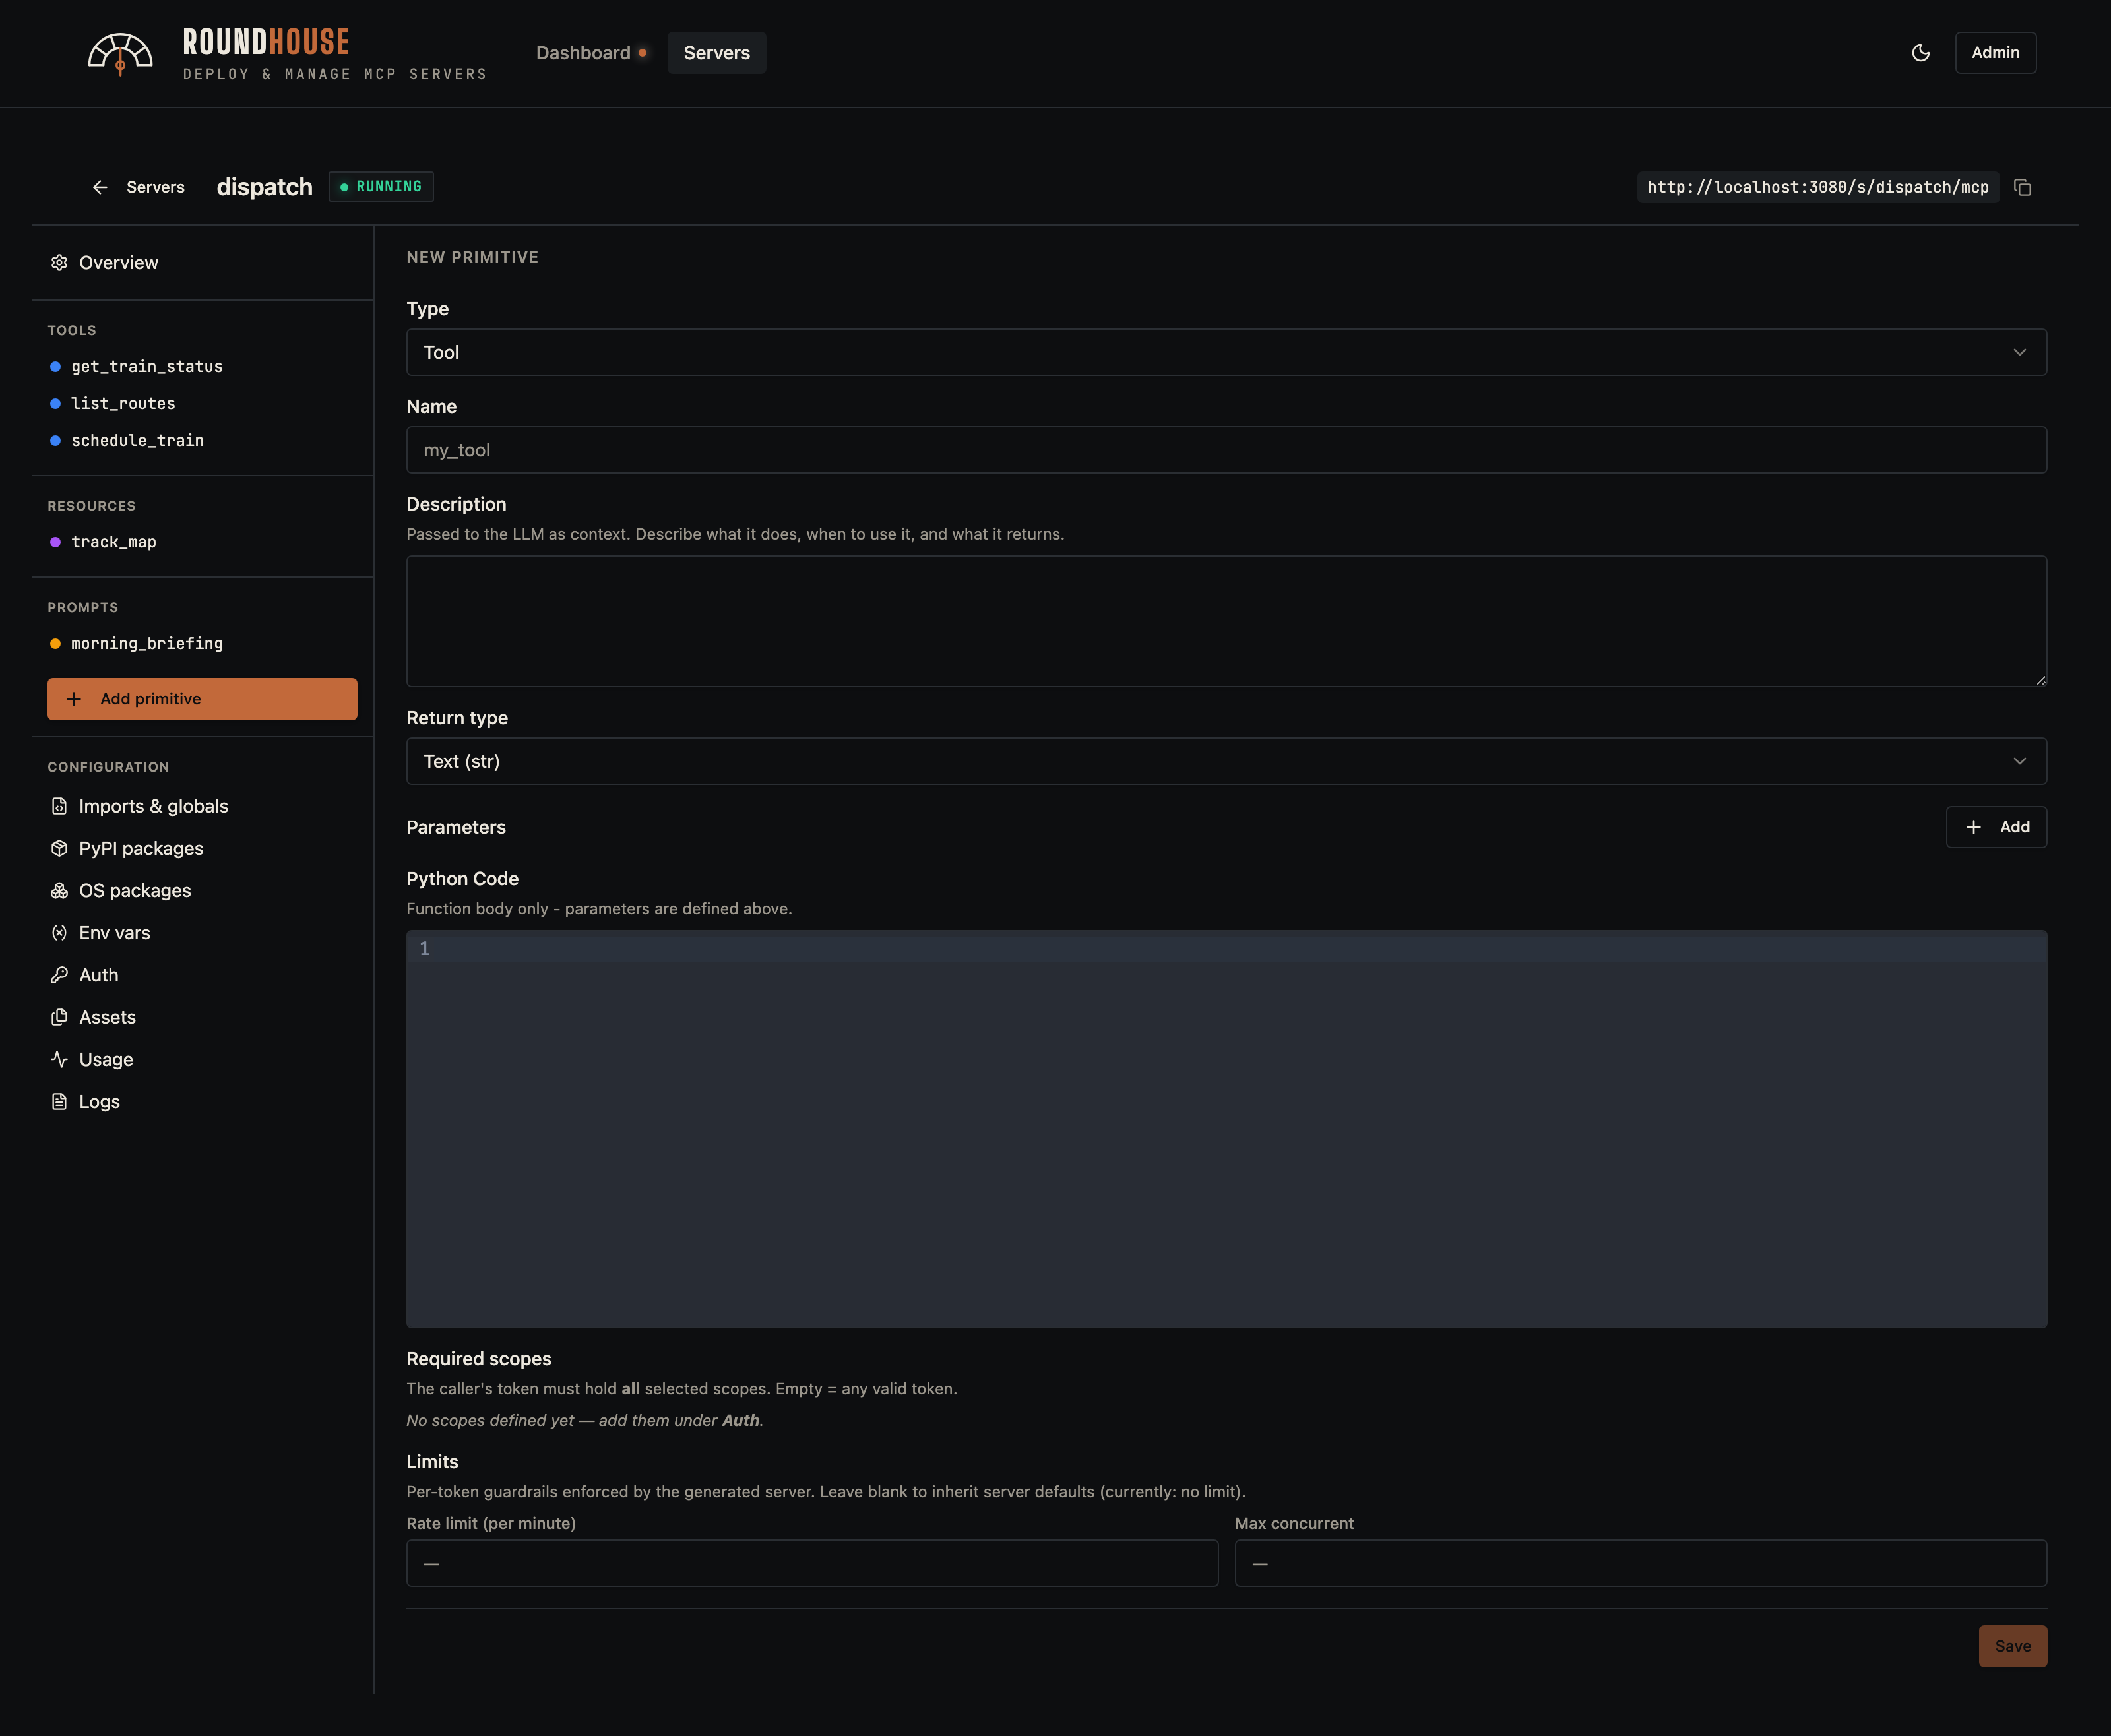
Adding a new primitive#
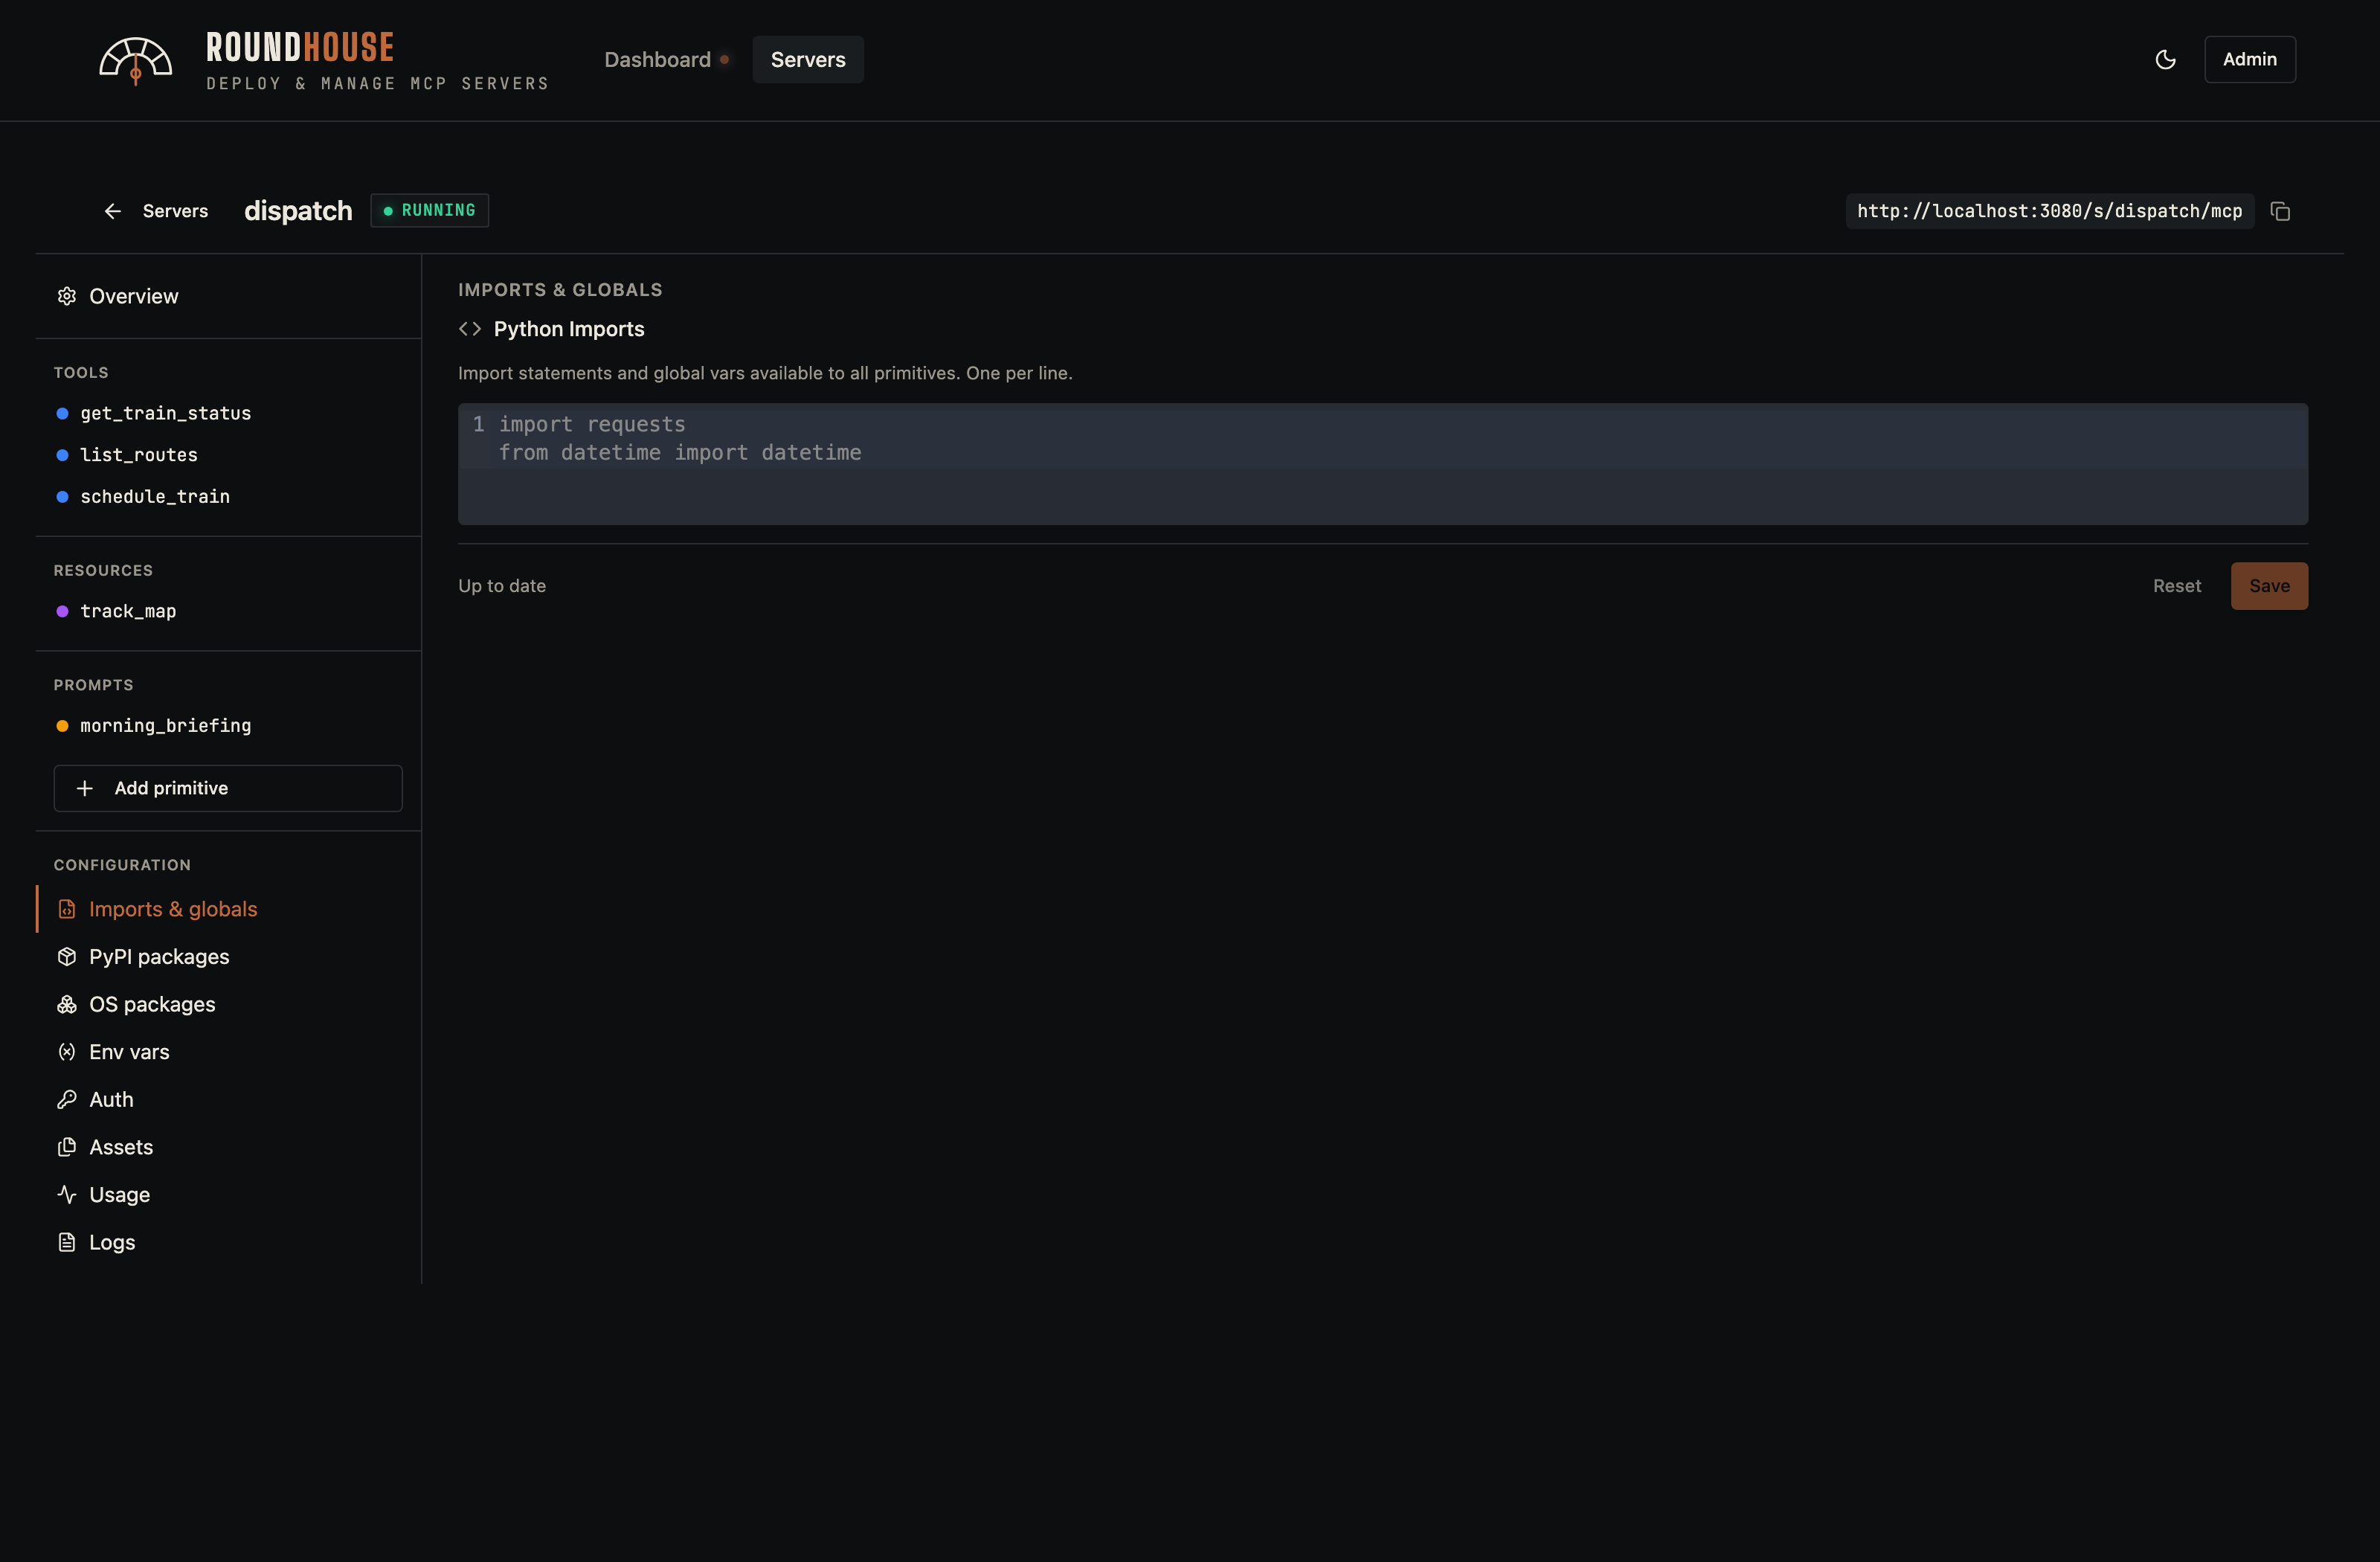
Imports and globals#
Any free-form Python imports or module-level globals that should appear in the generated server.py.
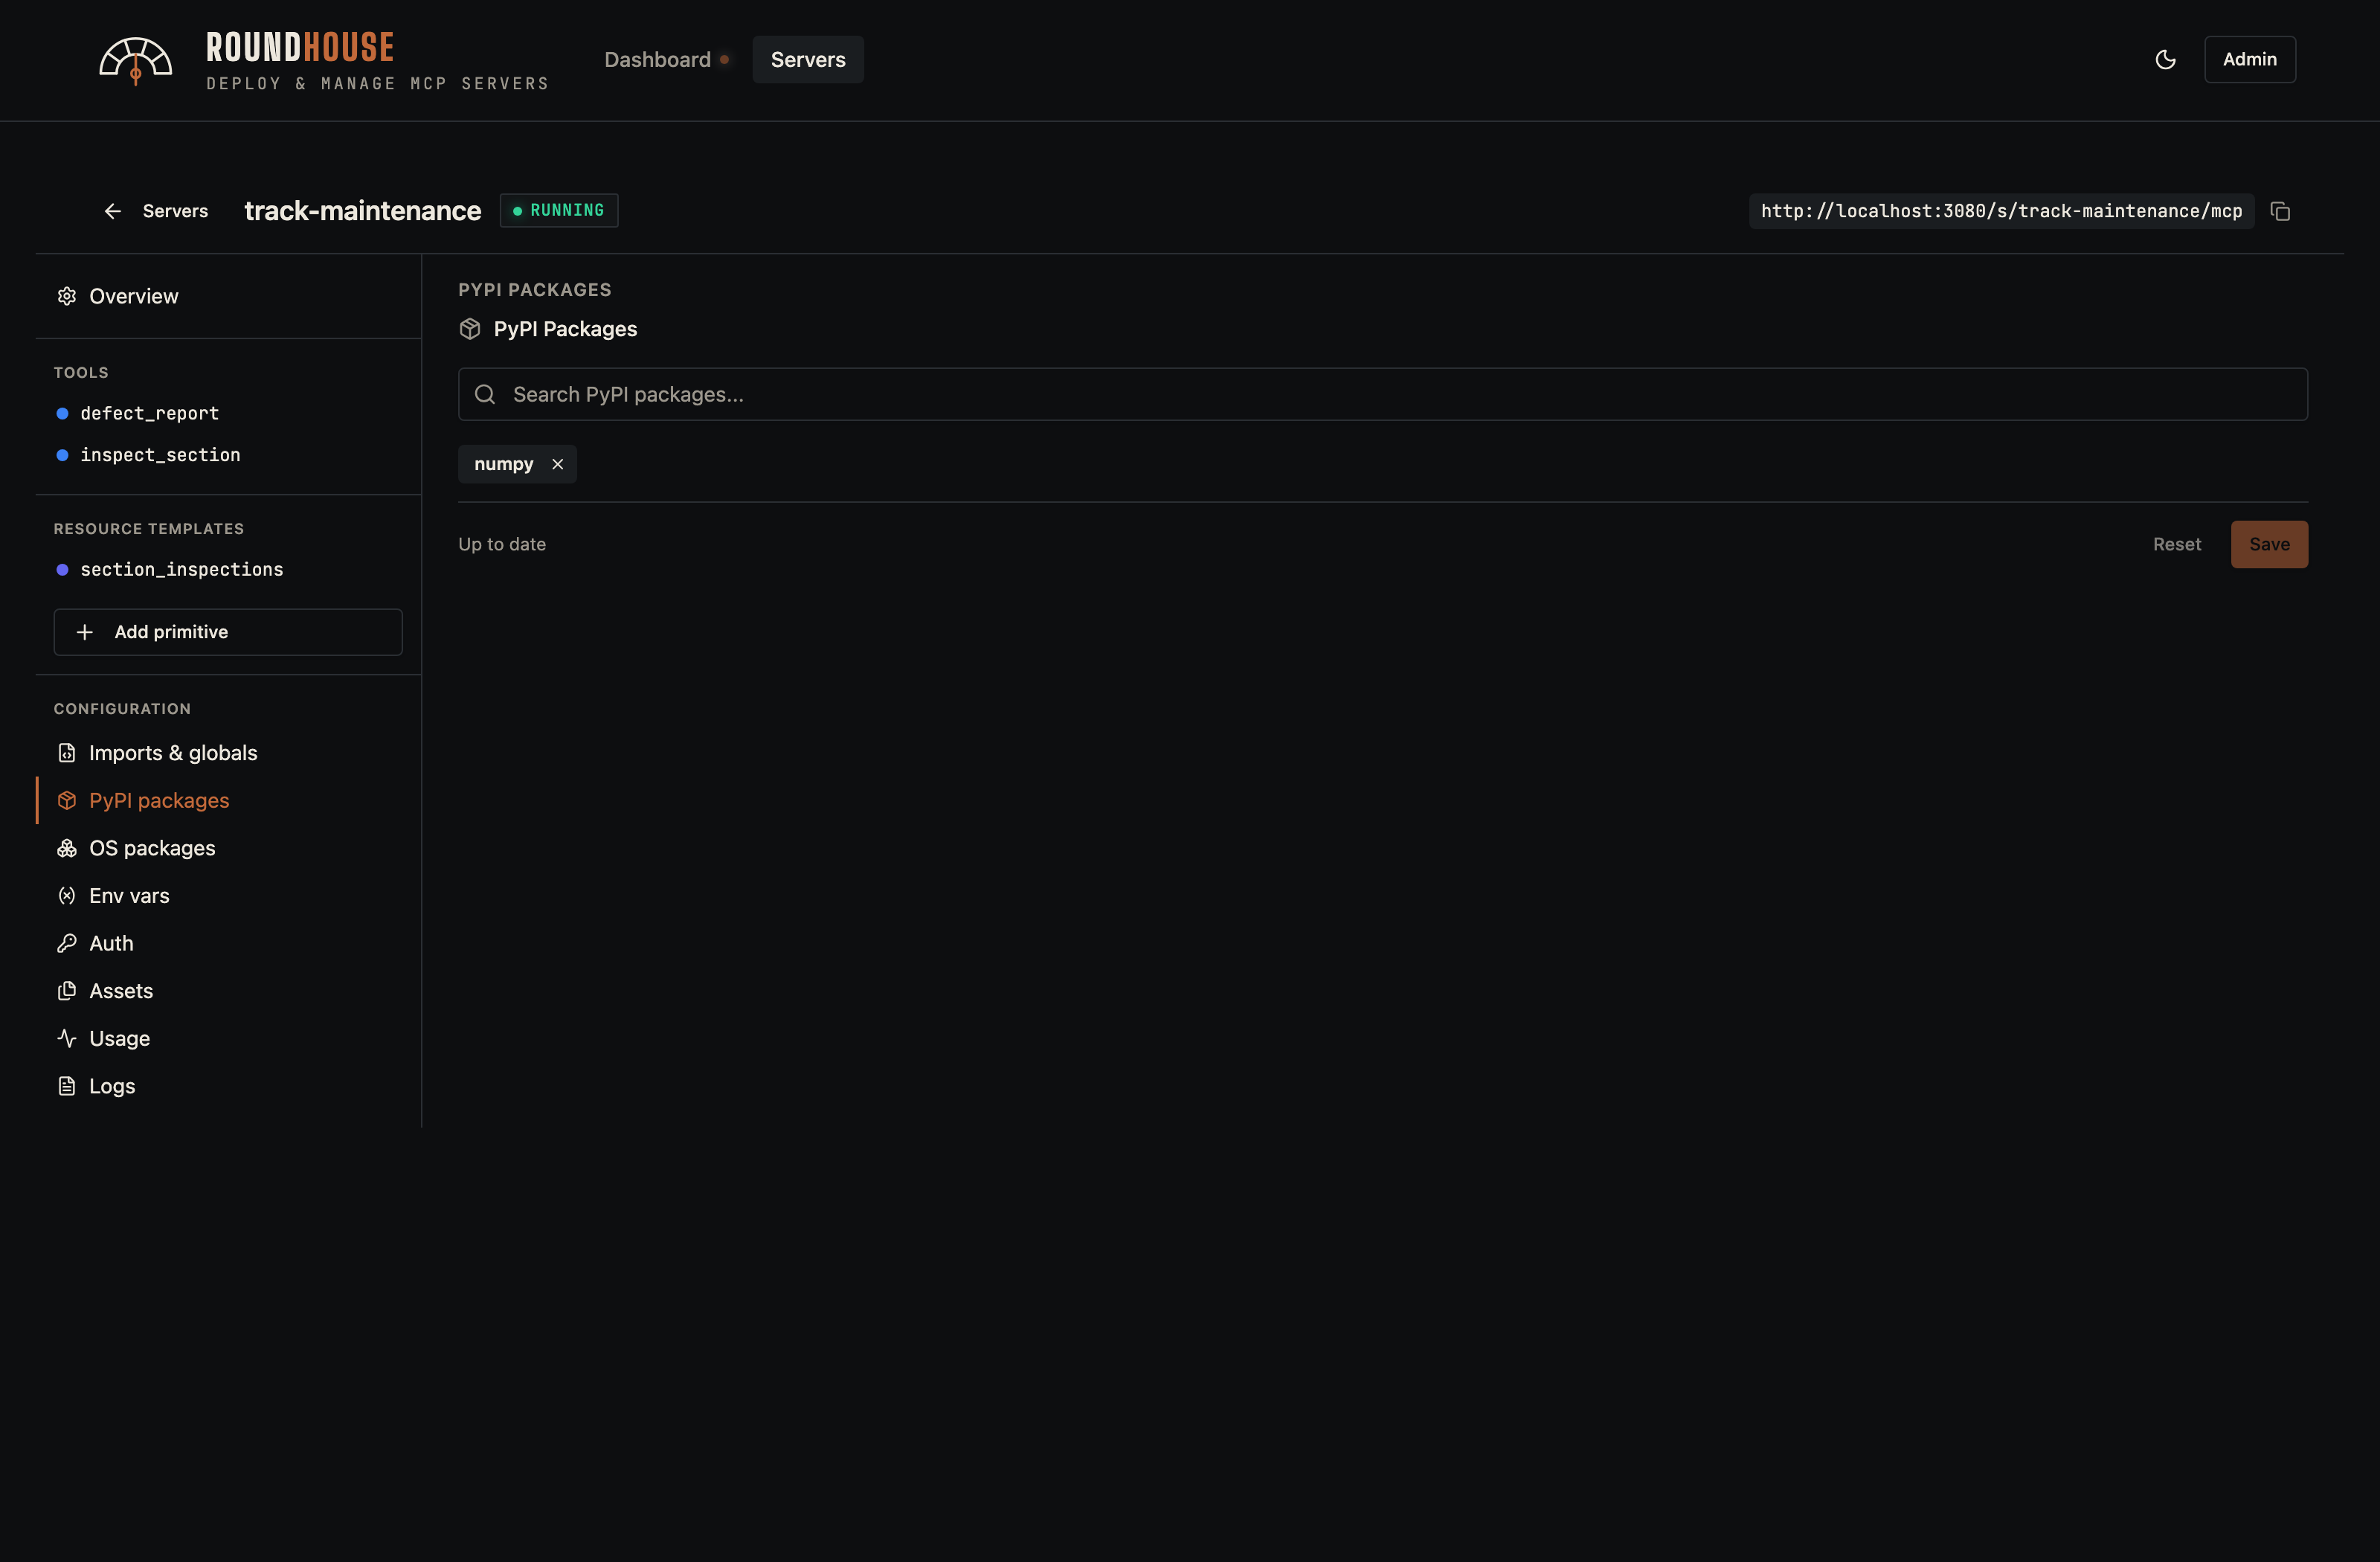
PyPI packages#
Pip dependencies. They are pinned into the generated Dockerfile and installed at build time.
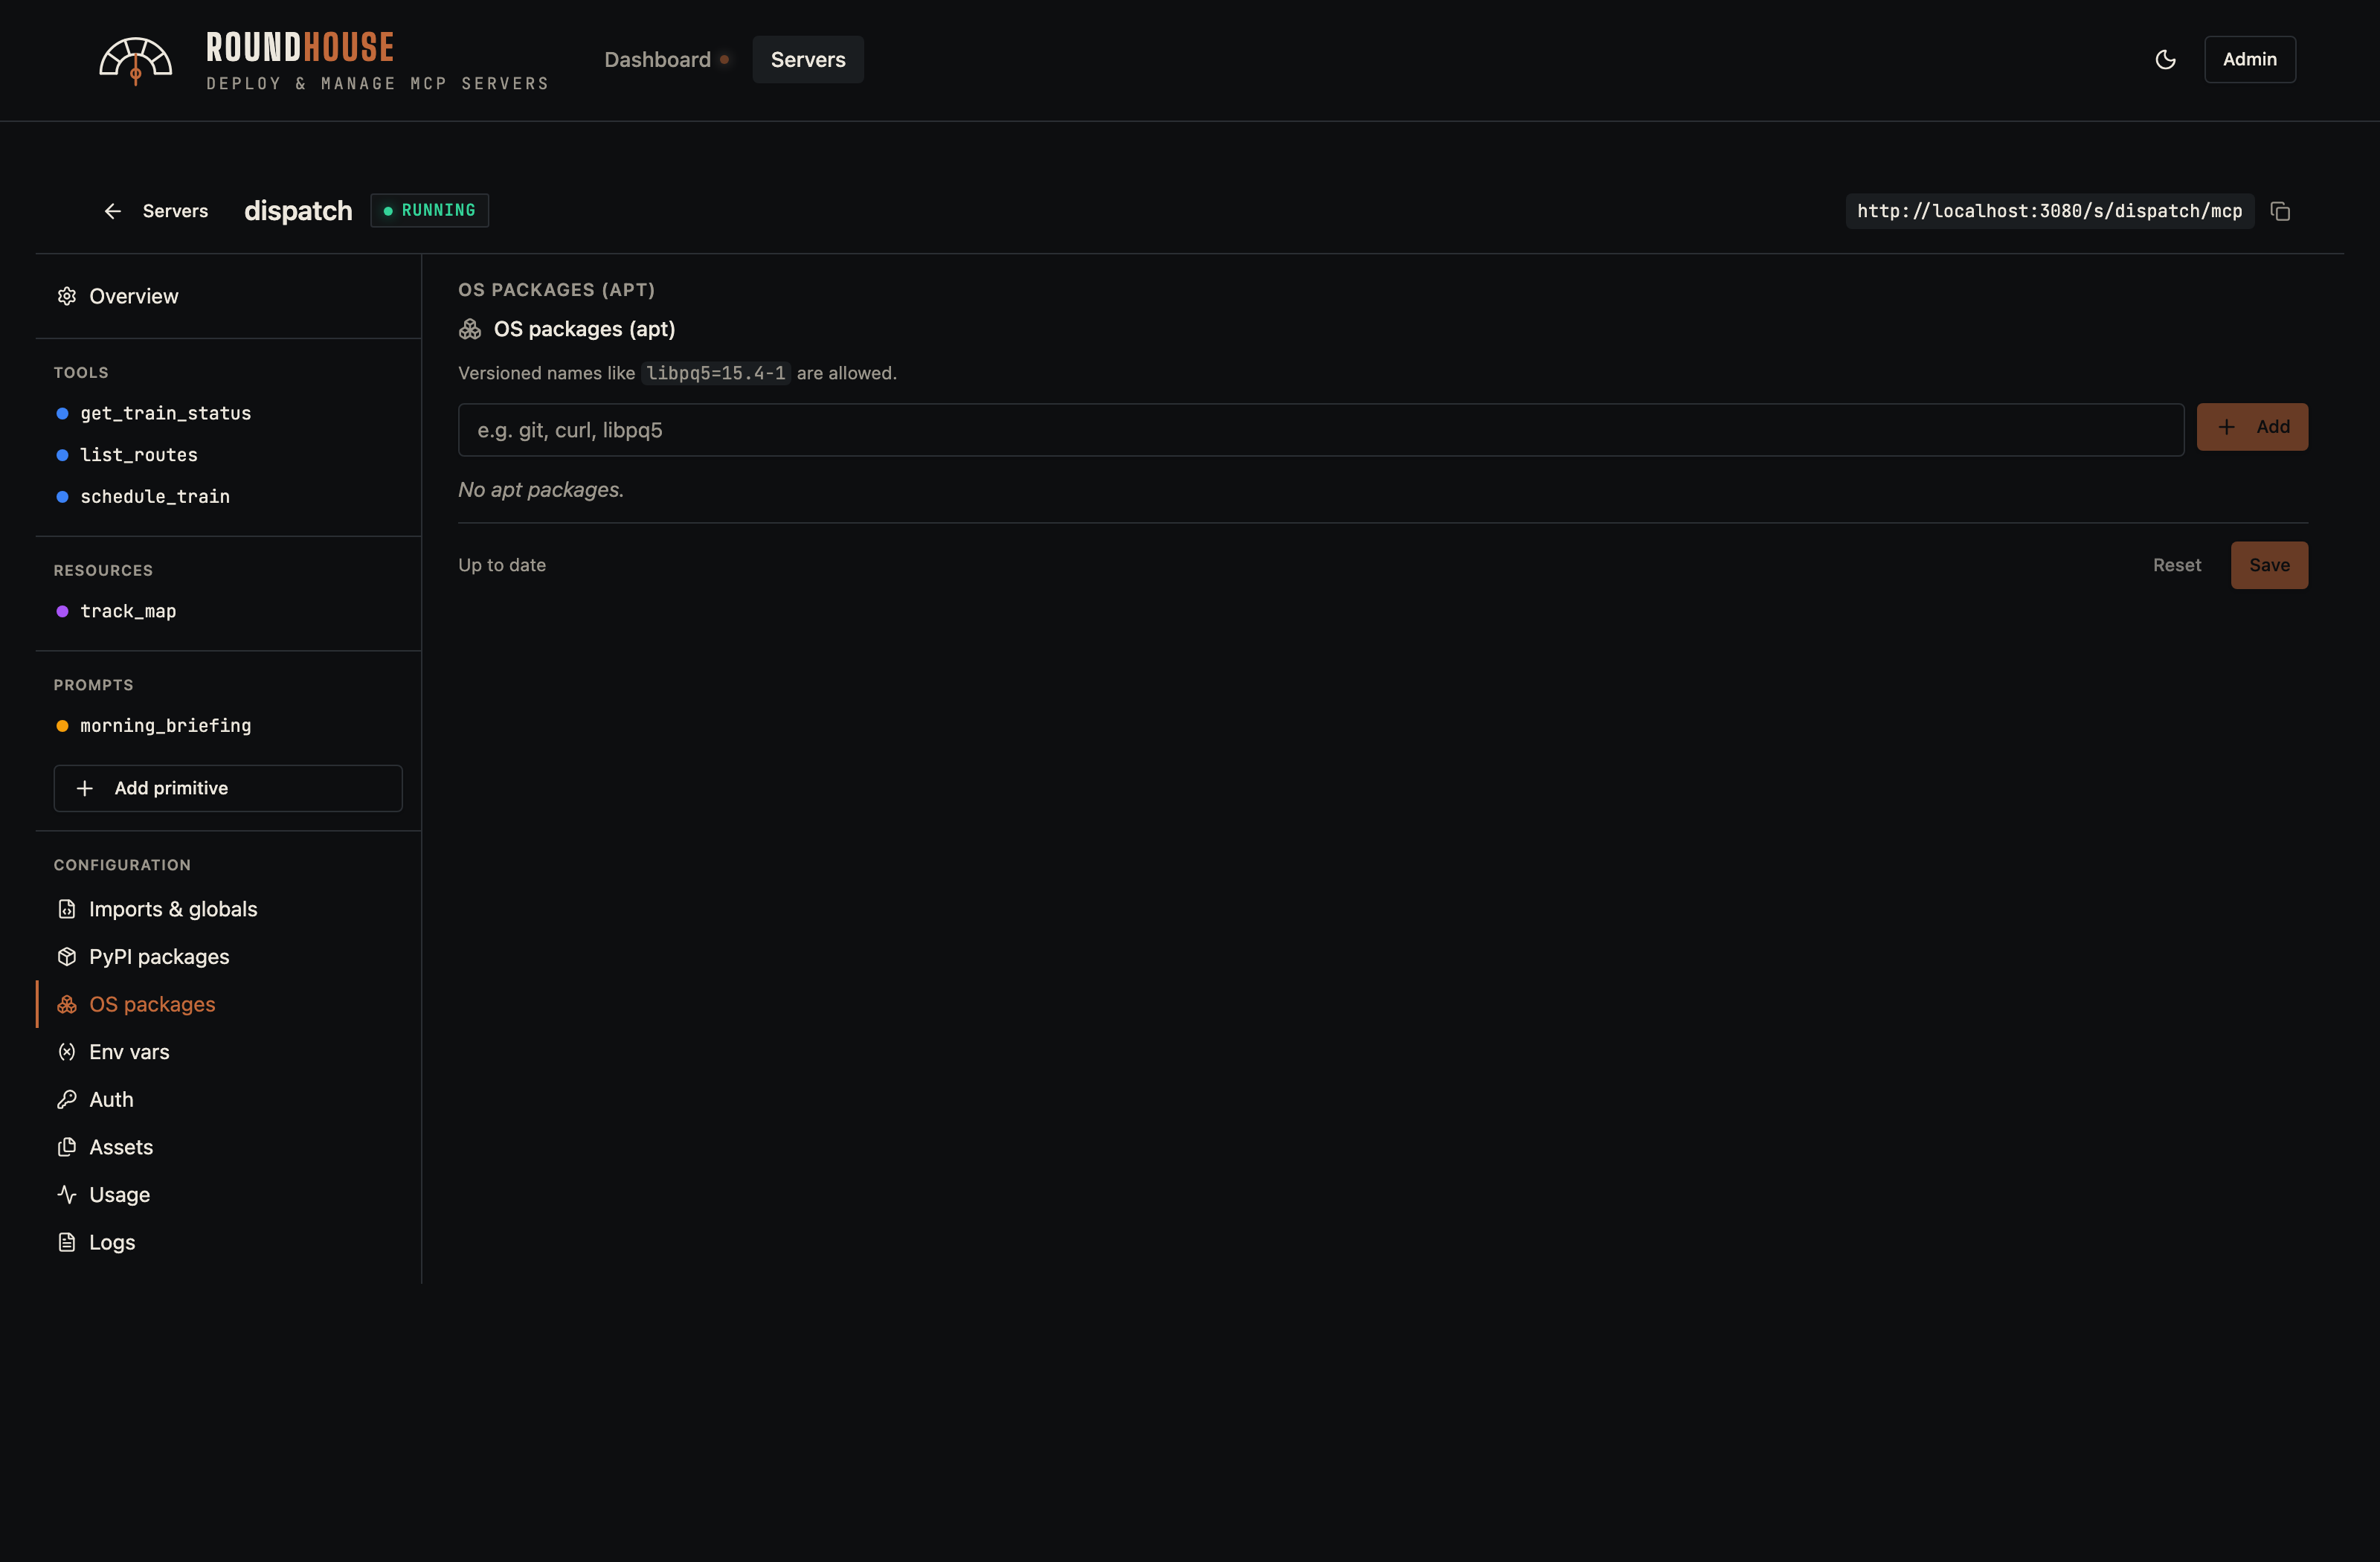
APT packages#
OS-level packages installed via apt-get in the build. Use for native toolchains a Python wheel needs.
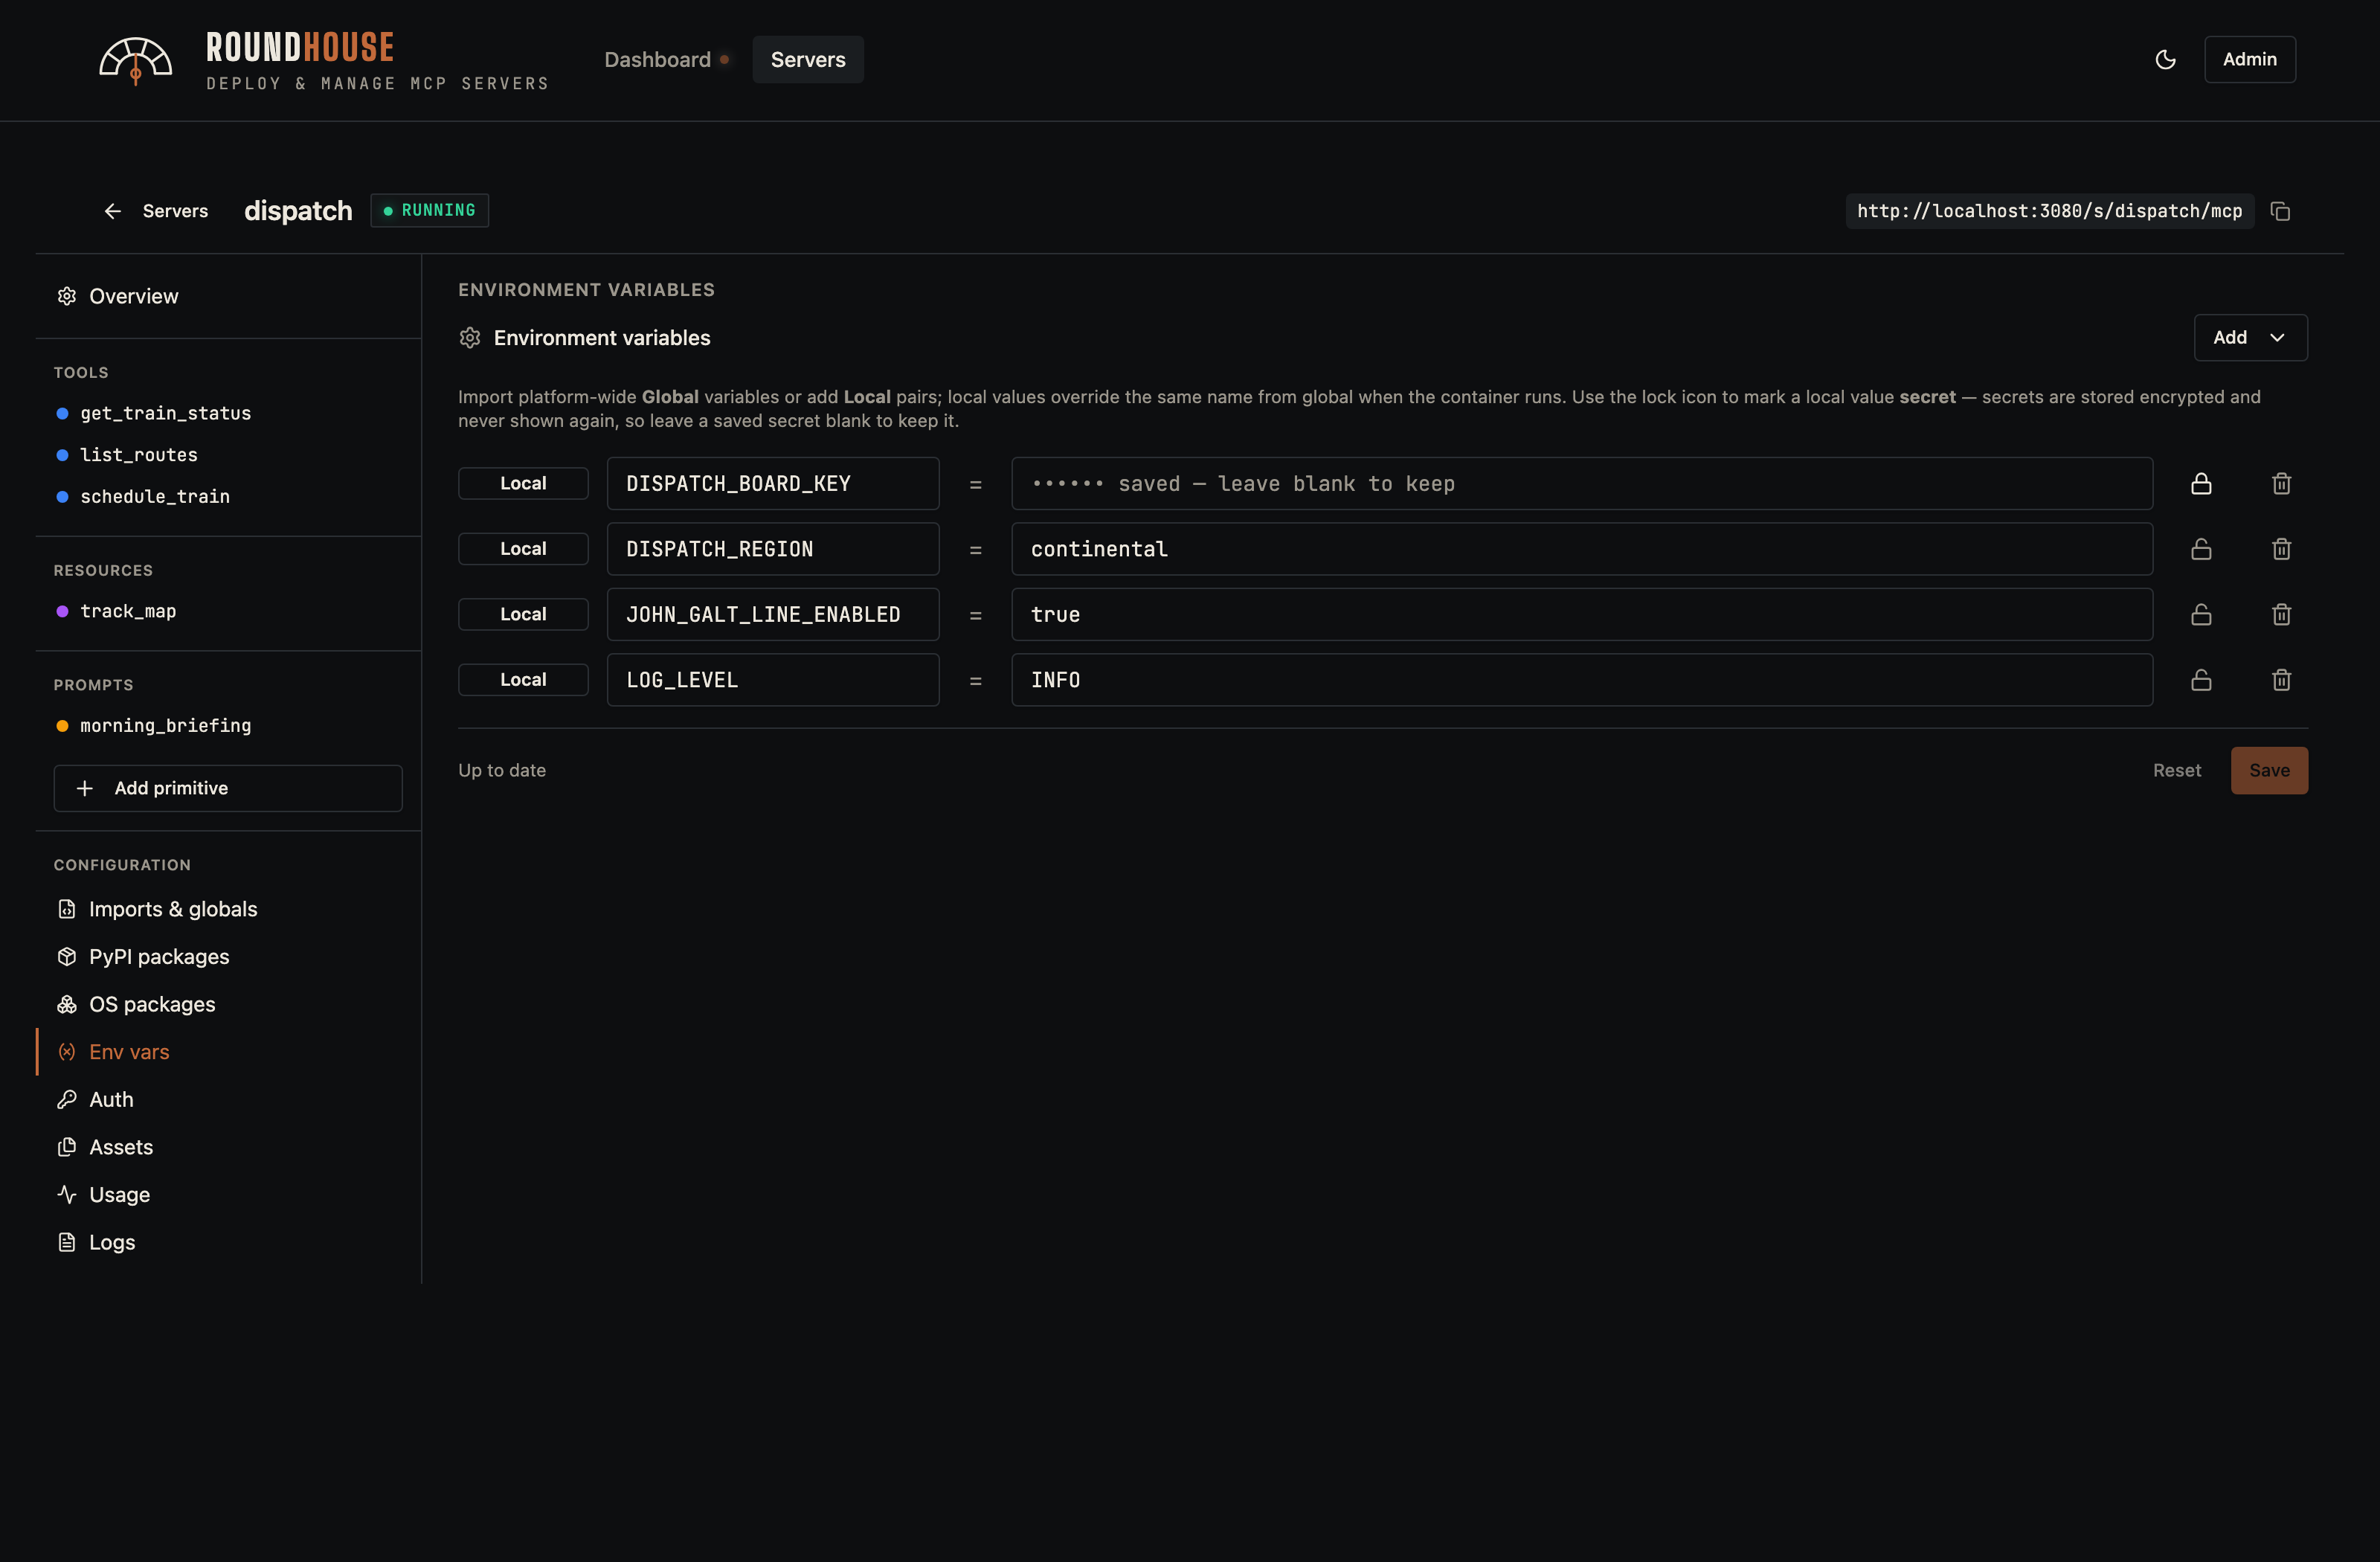
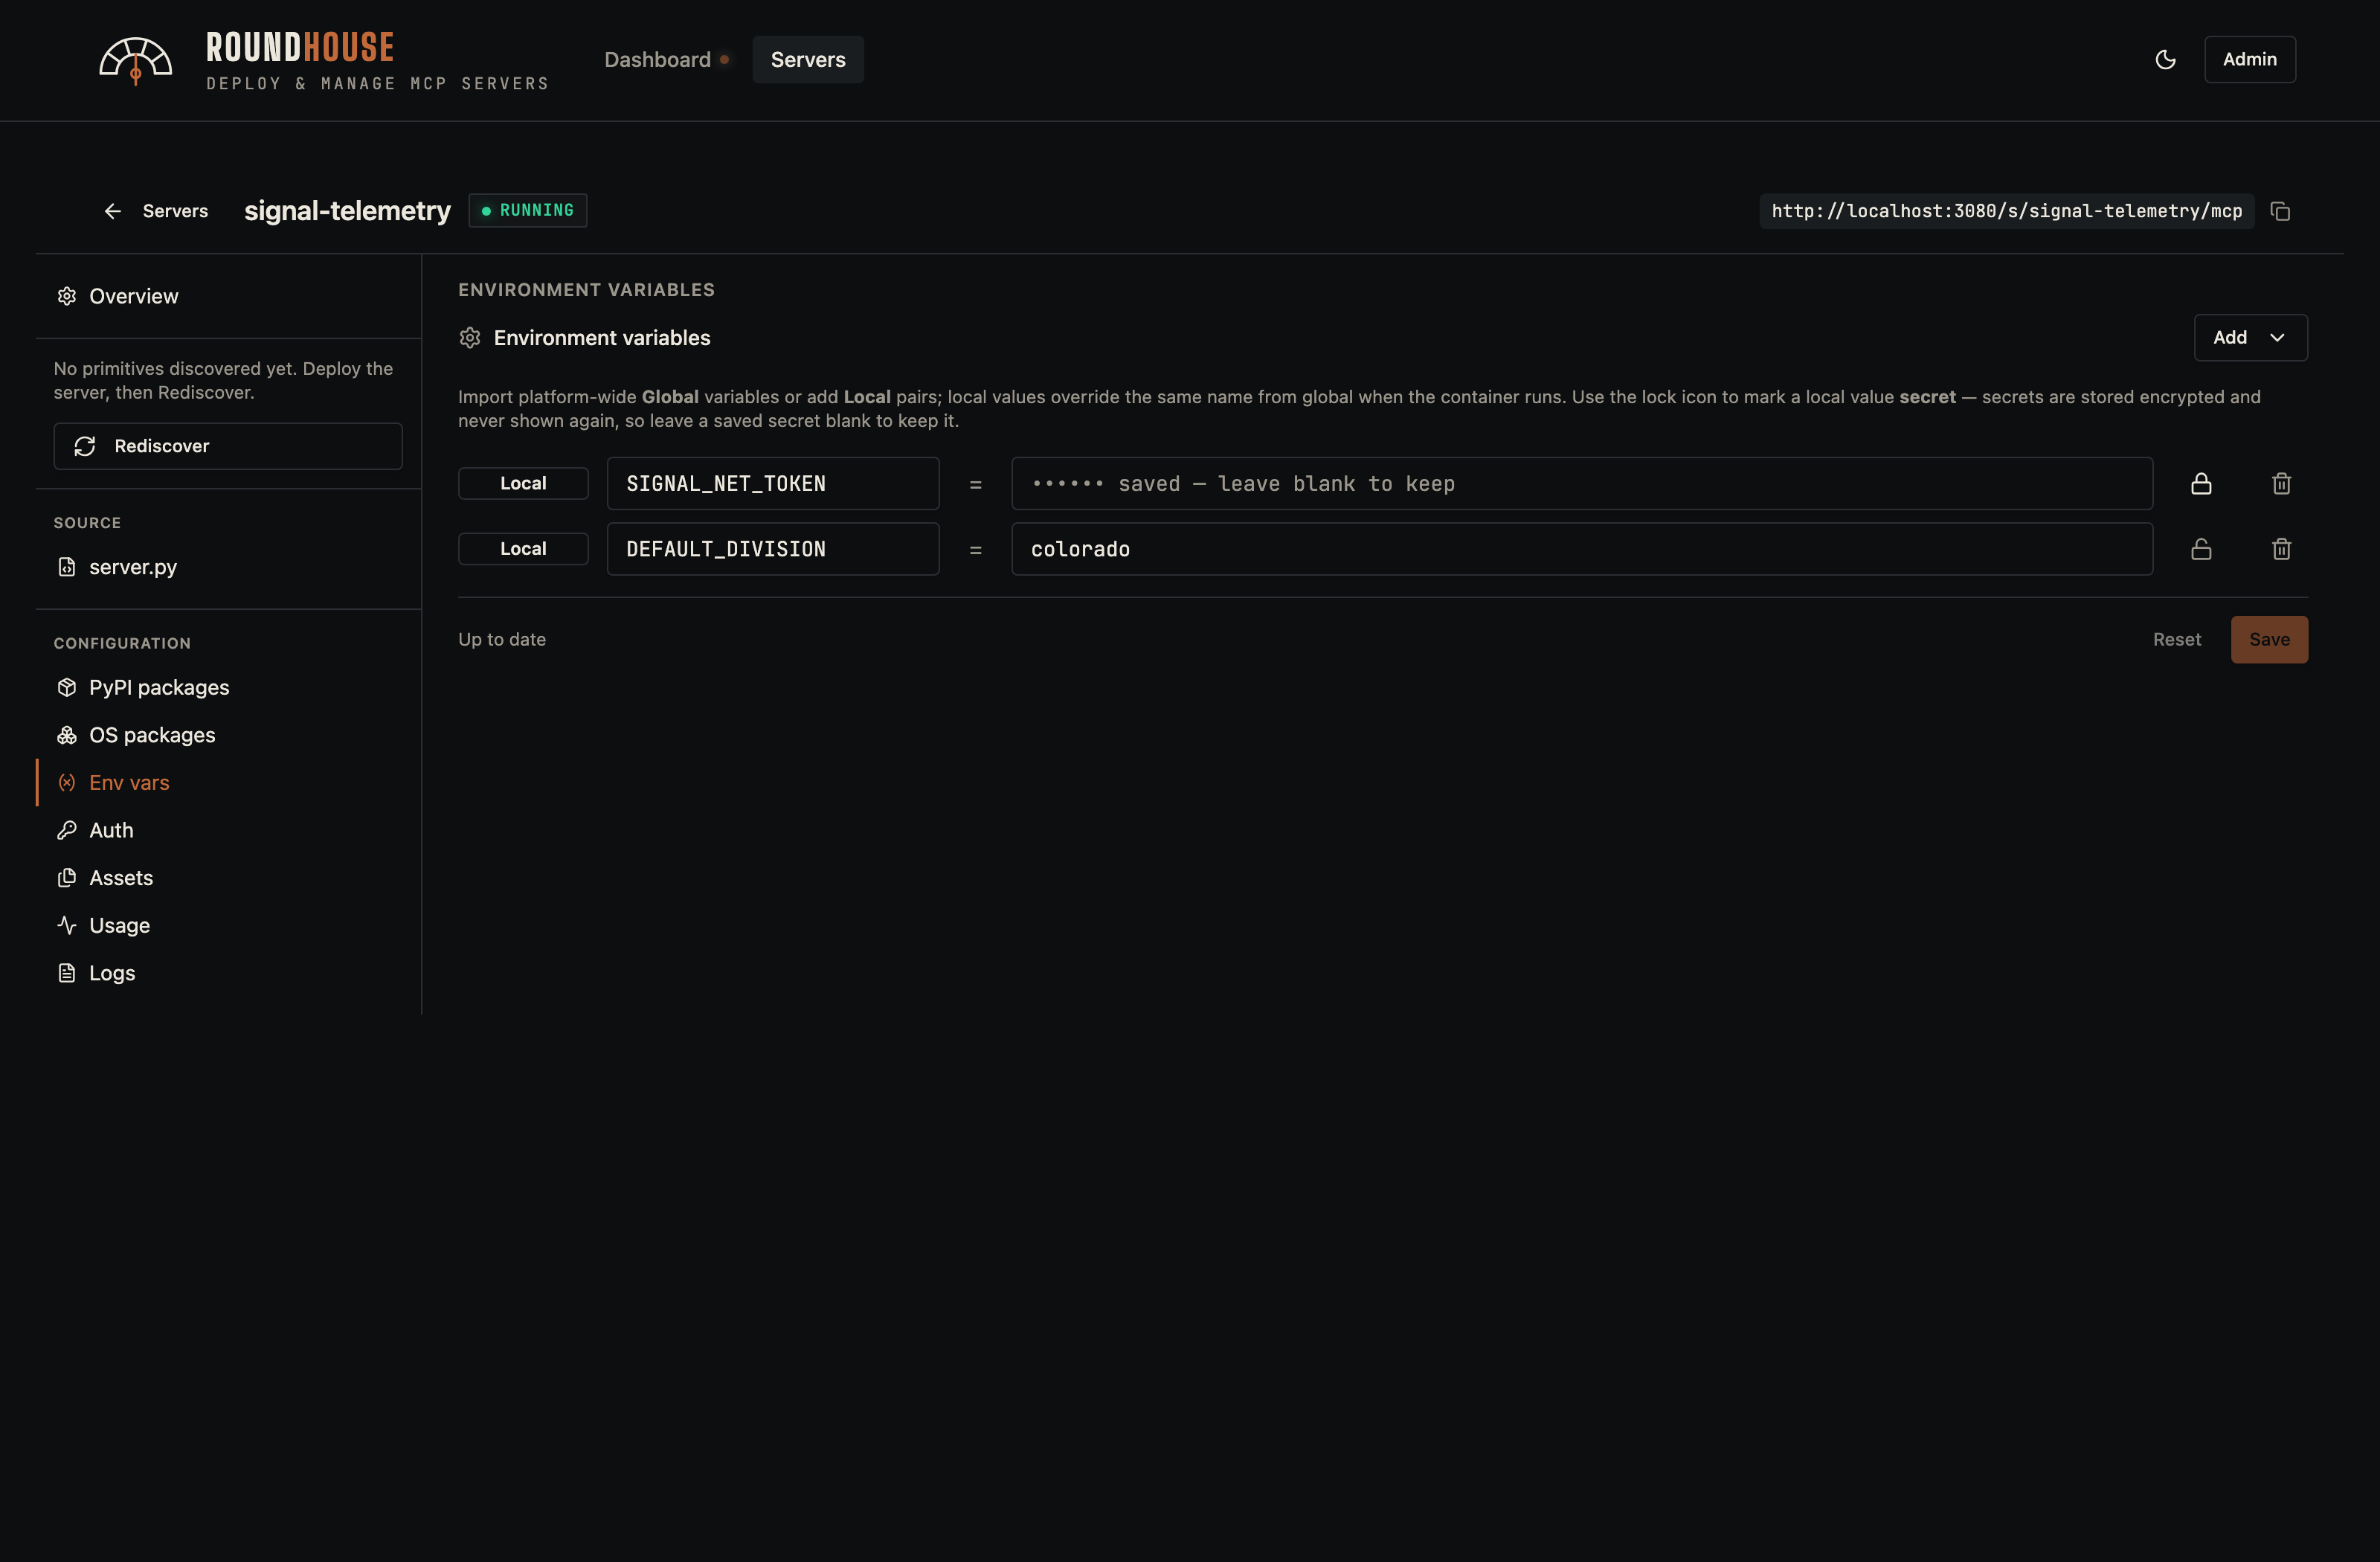
Environment variables#
Per-server env vars (with optional encrypted-at-rest secrets) and global imports. Changes save instantly; the redeploy banner surfaces because the new value only takes effect on the next container restart.
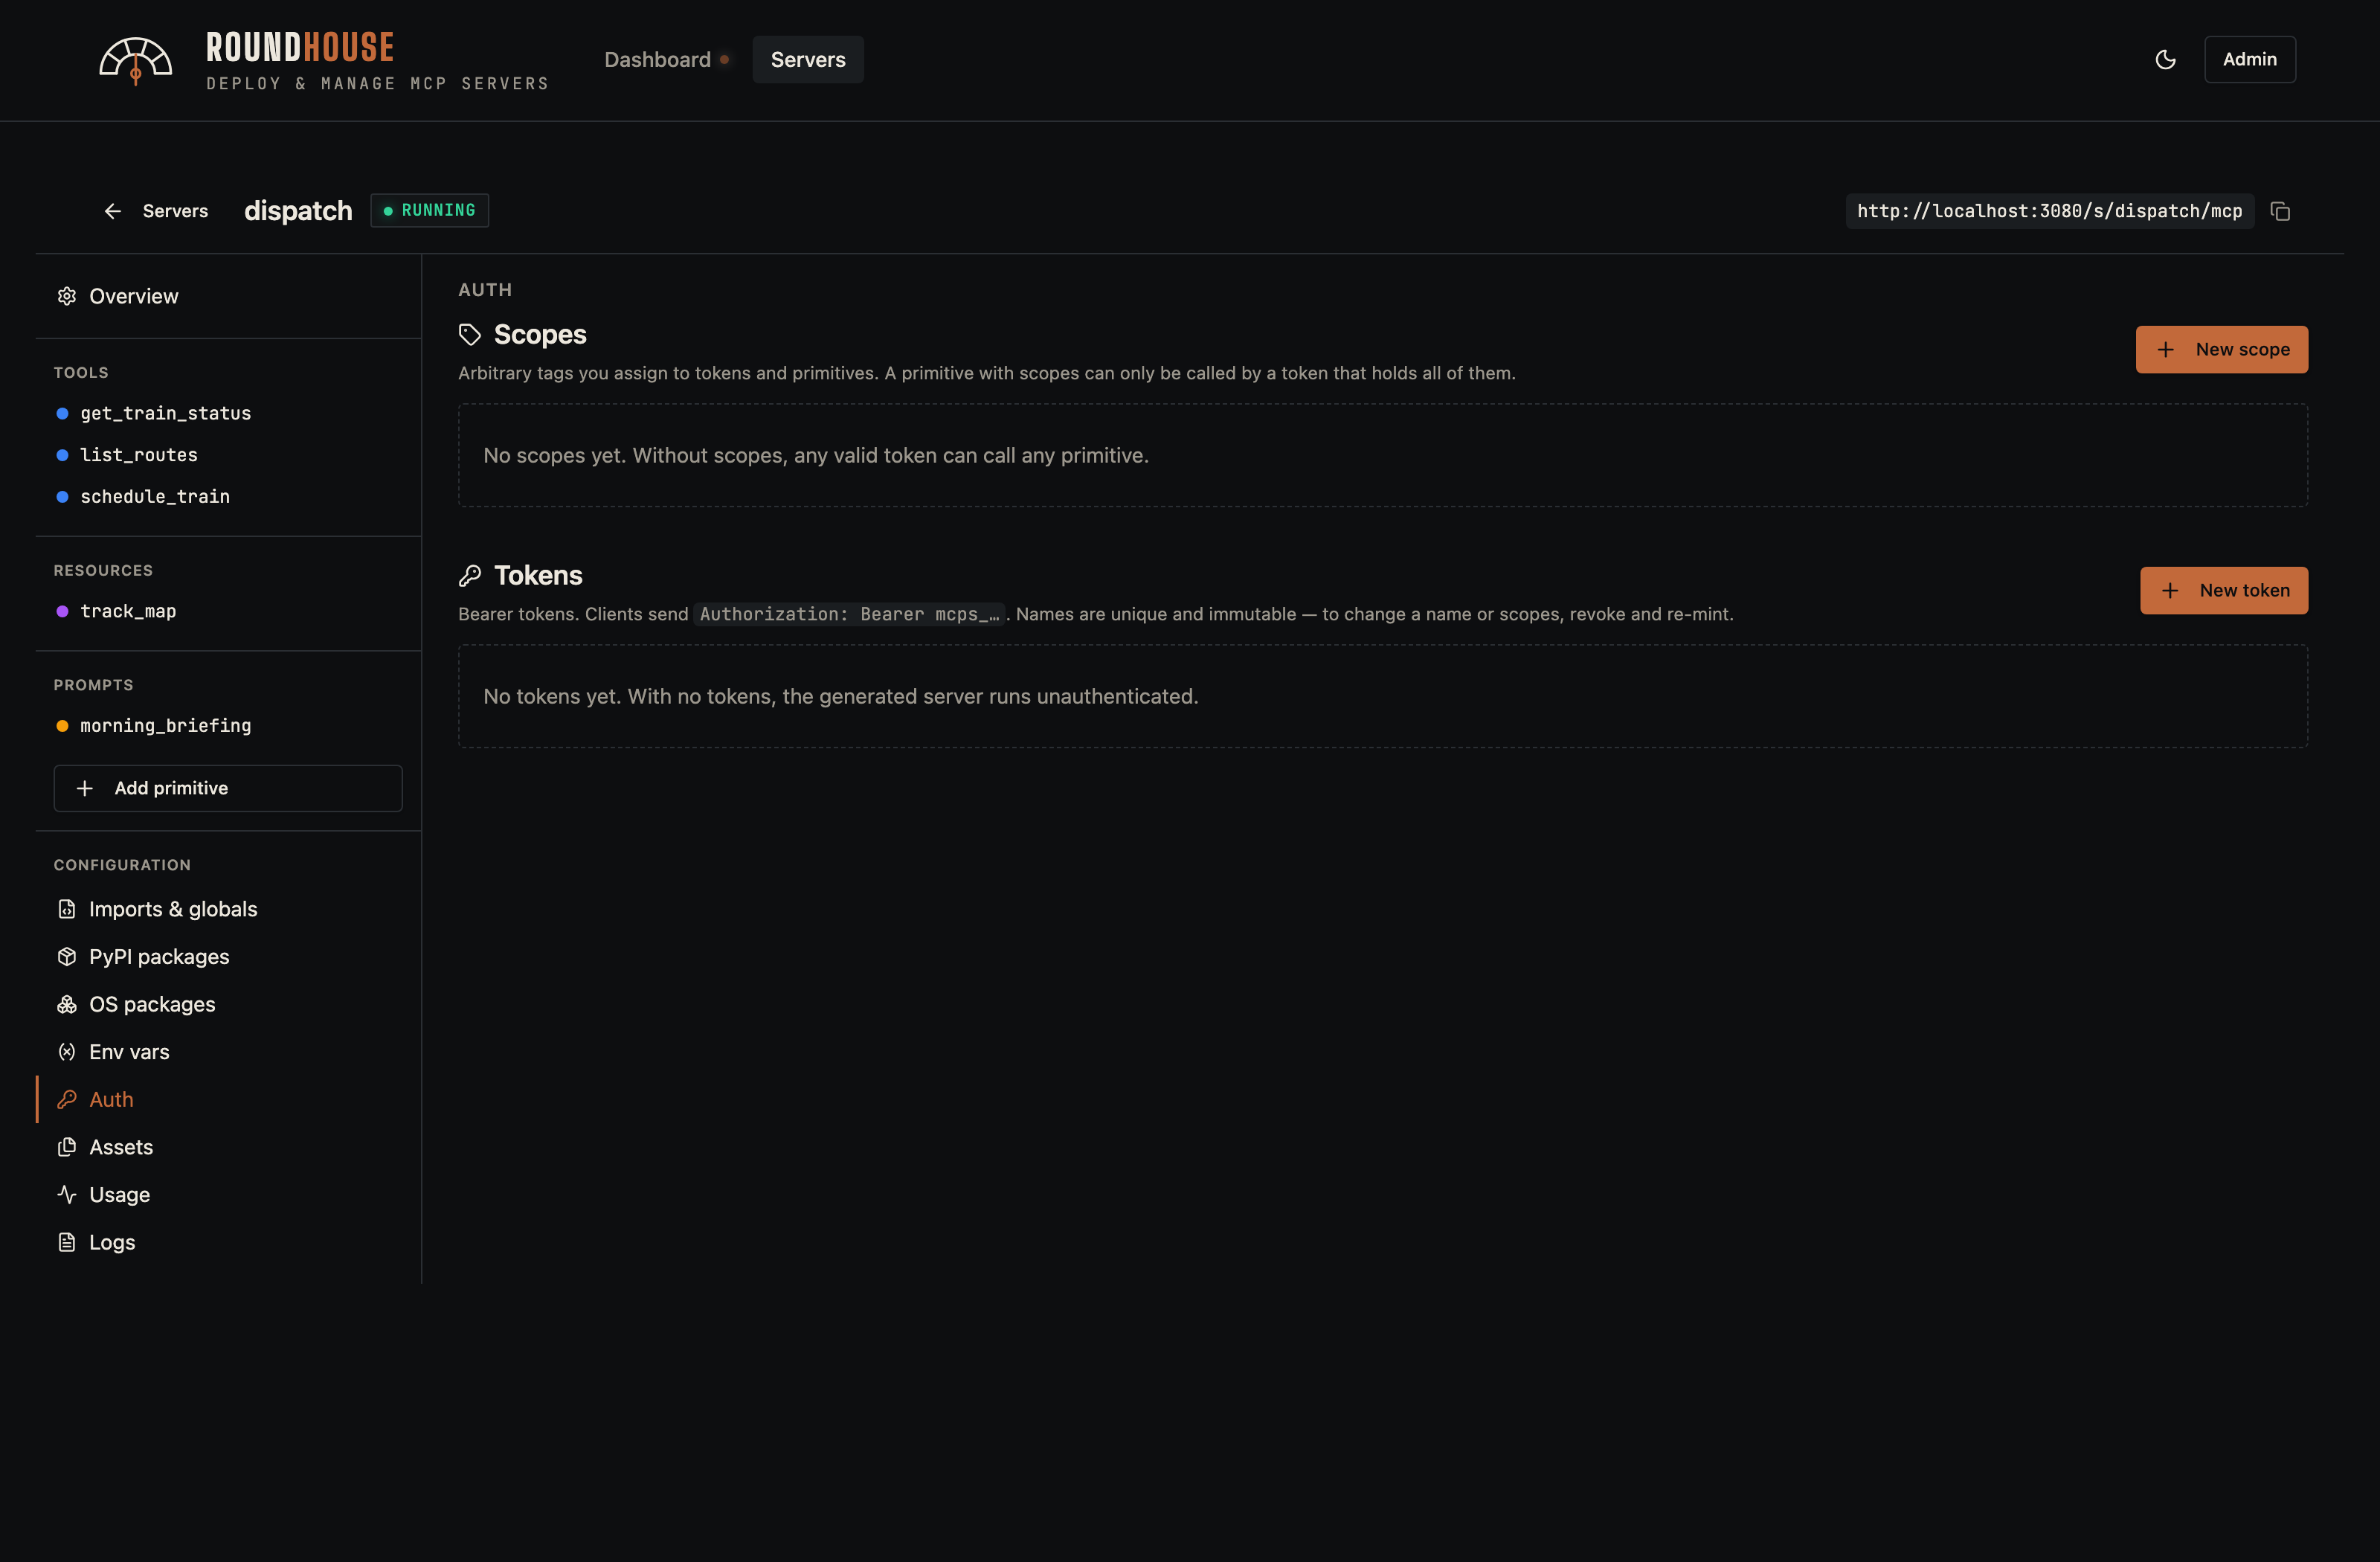
Auth (server tokens)#
Bearer tokens that callers present in the Authorization header. Per-token scopes can lock individual primitives down to specific token holders.
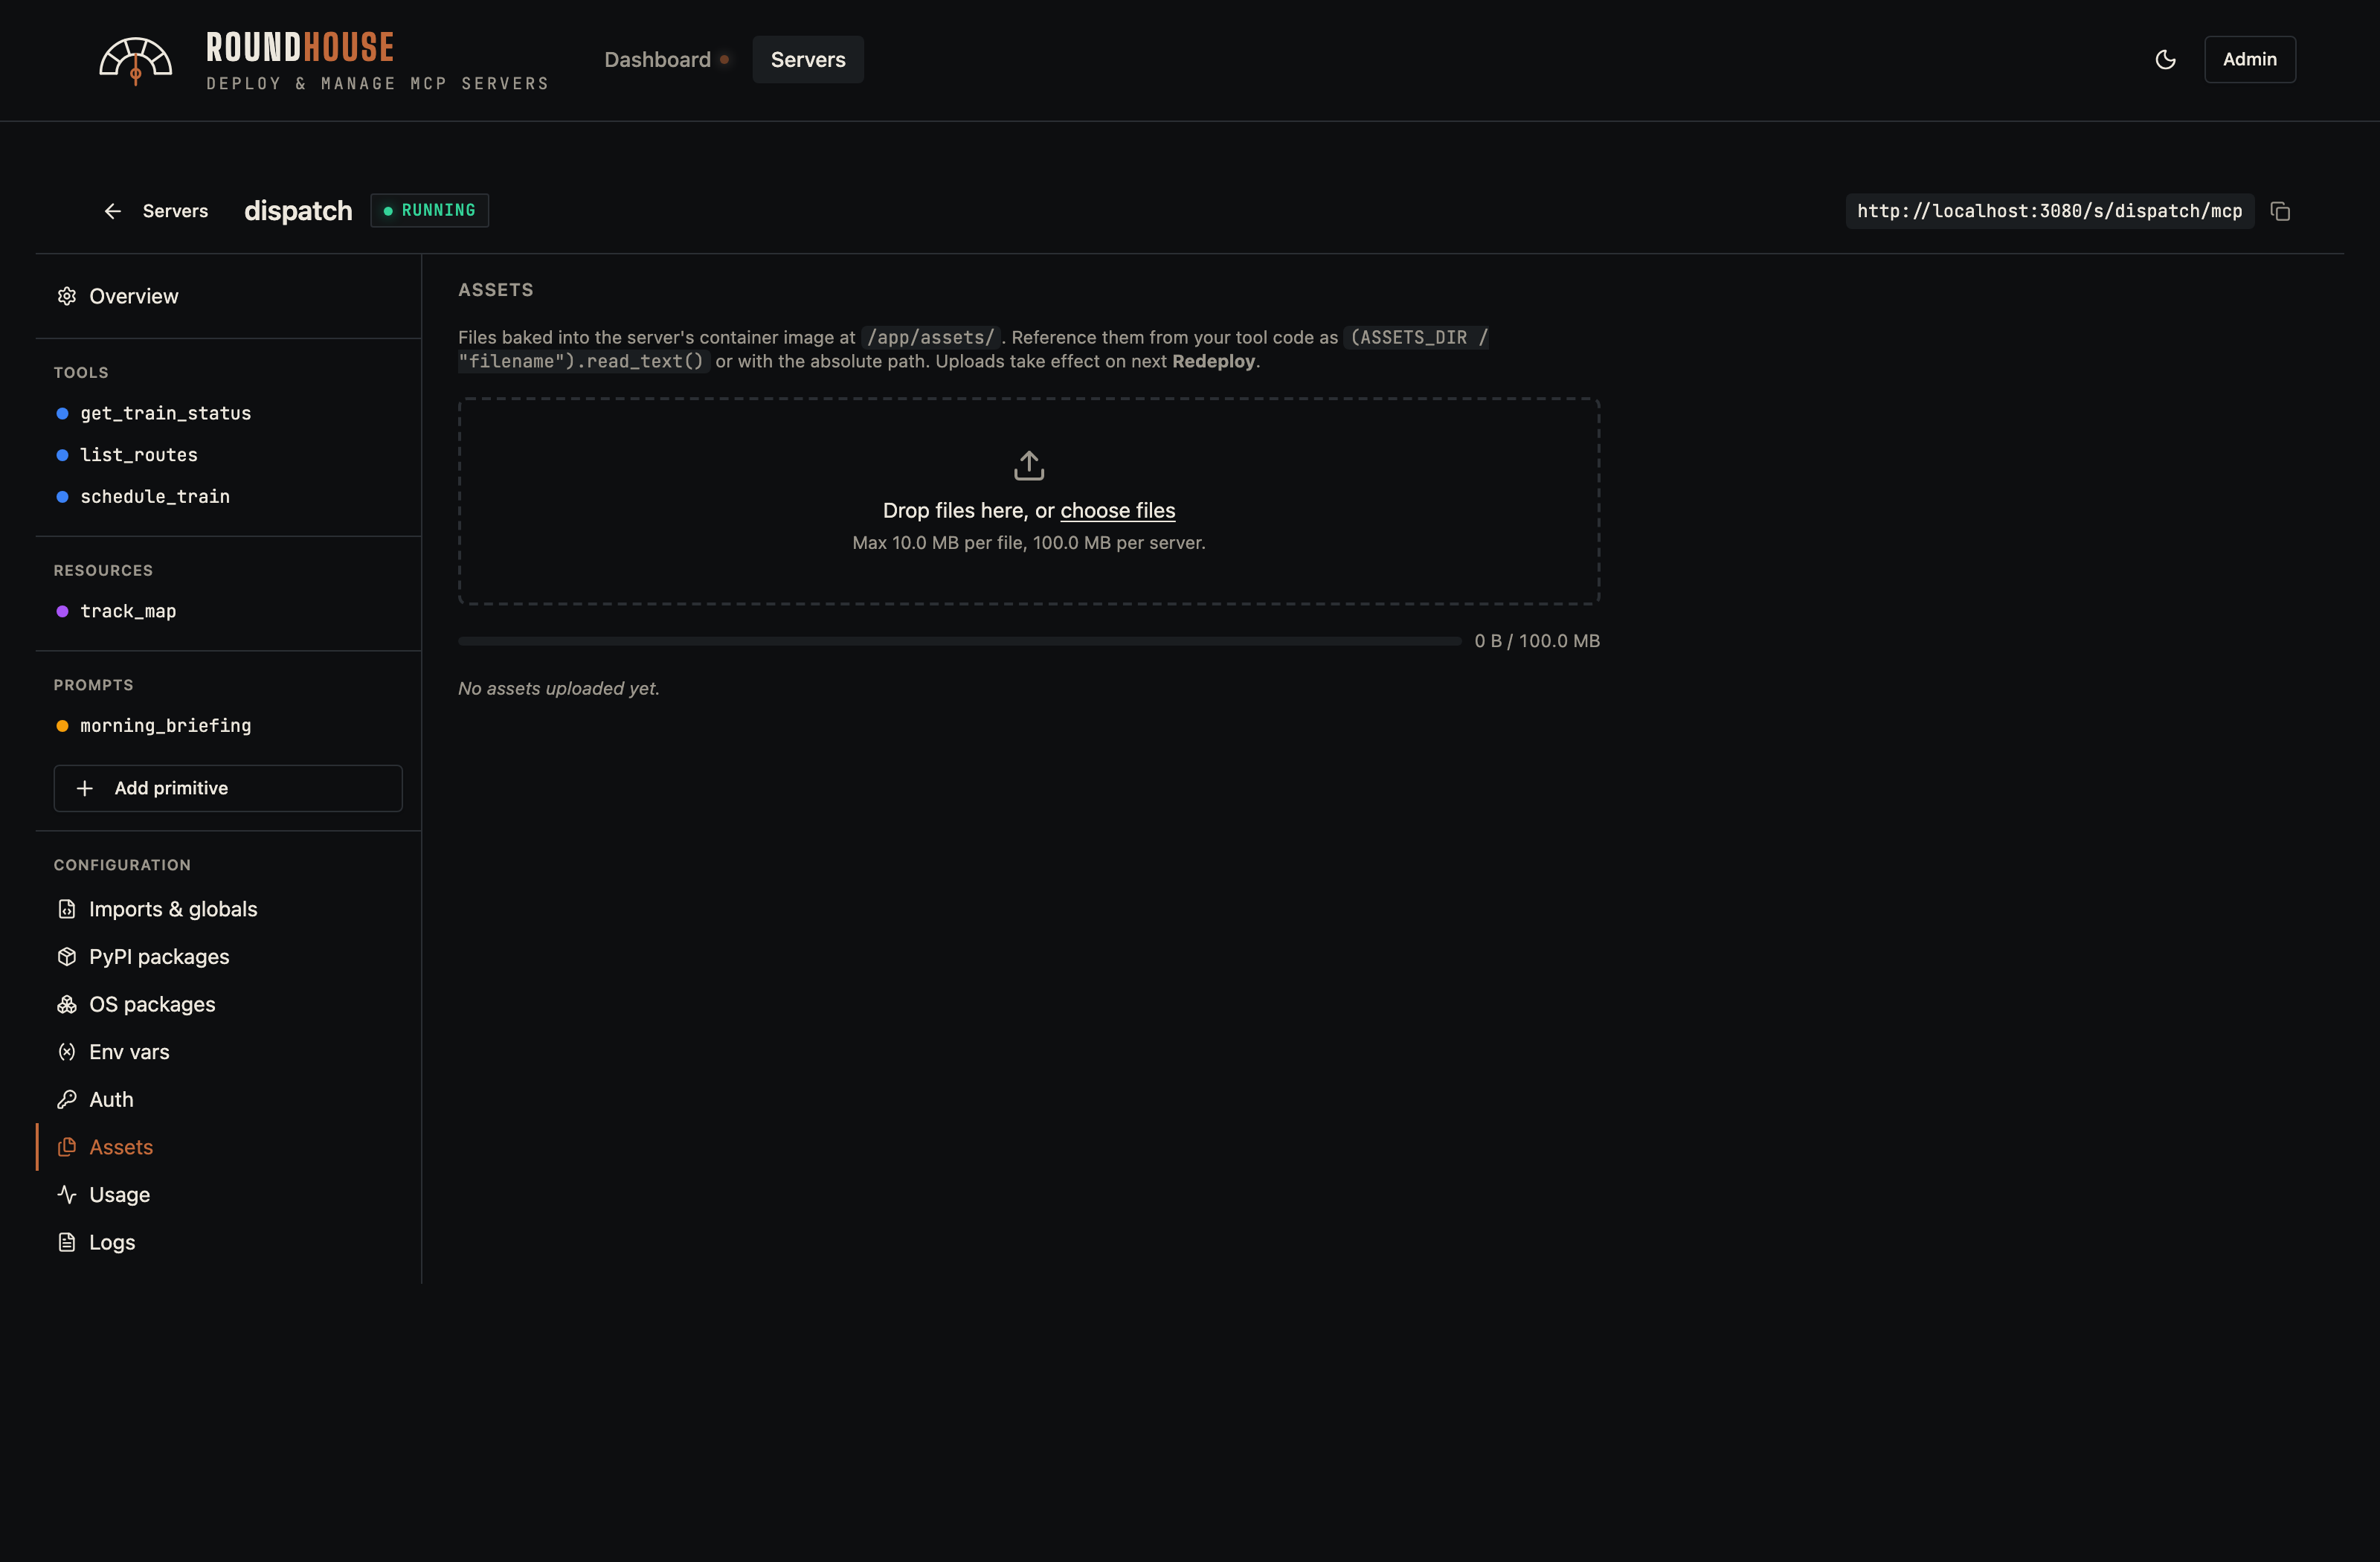
Assets#
Arbitrary files that get baked into the image under /app/assets/. Useful for prompt templates, large JSON fixtures, or any read-only data your tools reference at runtime.
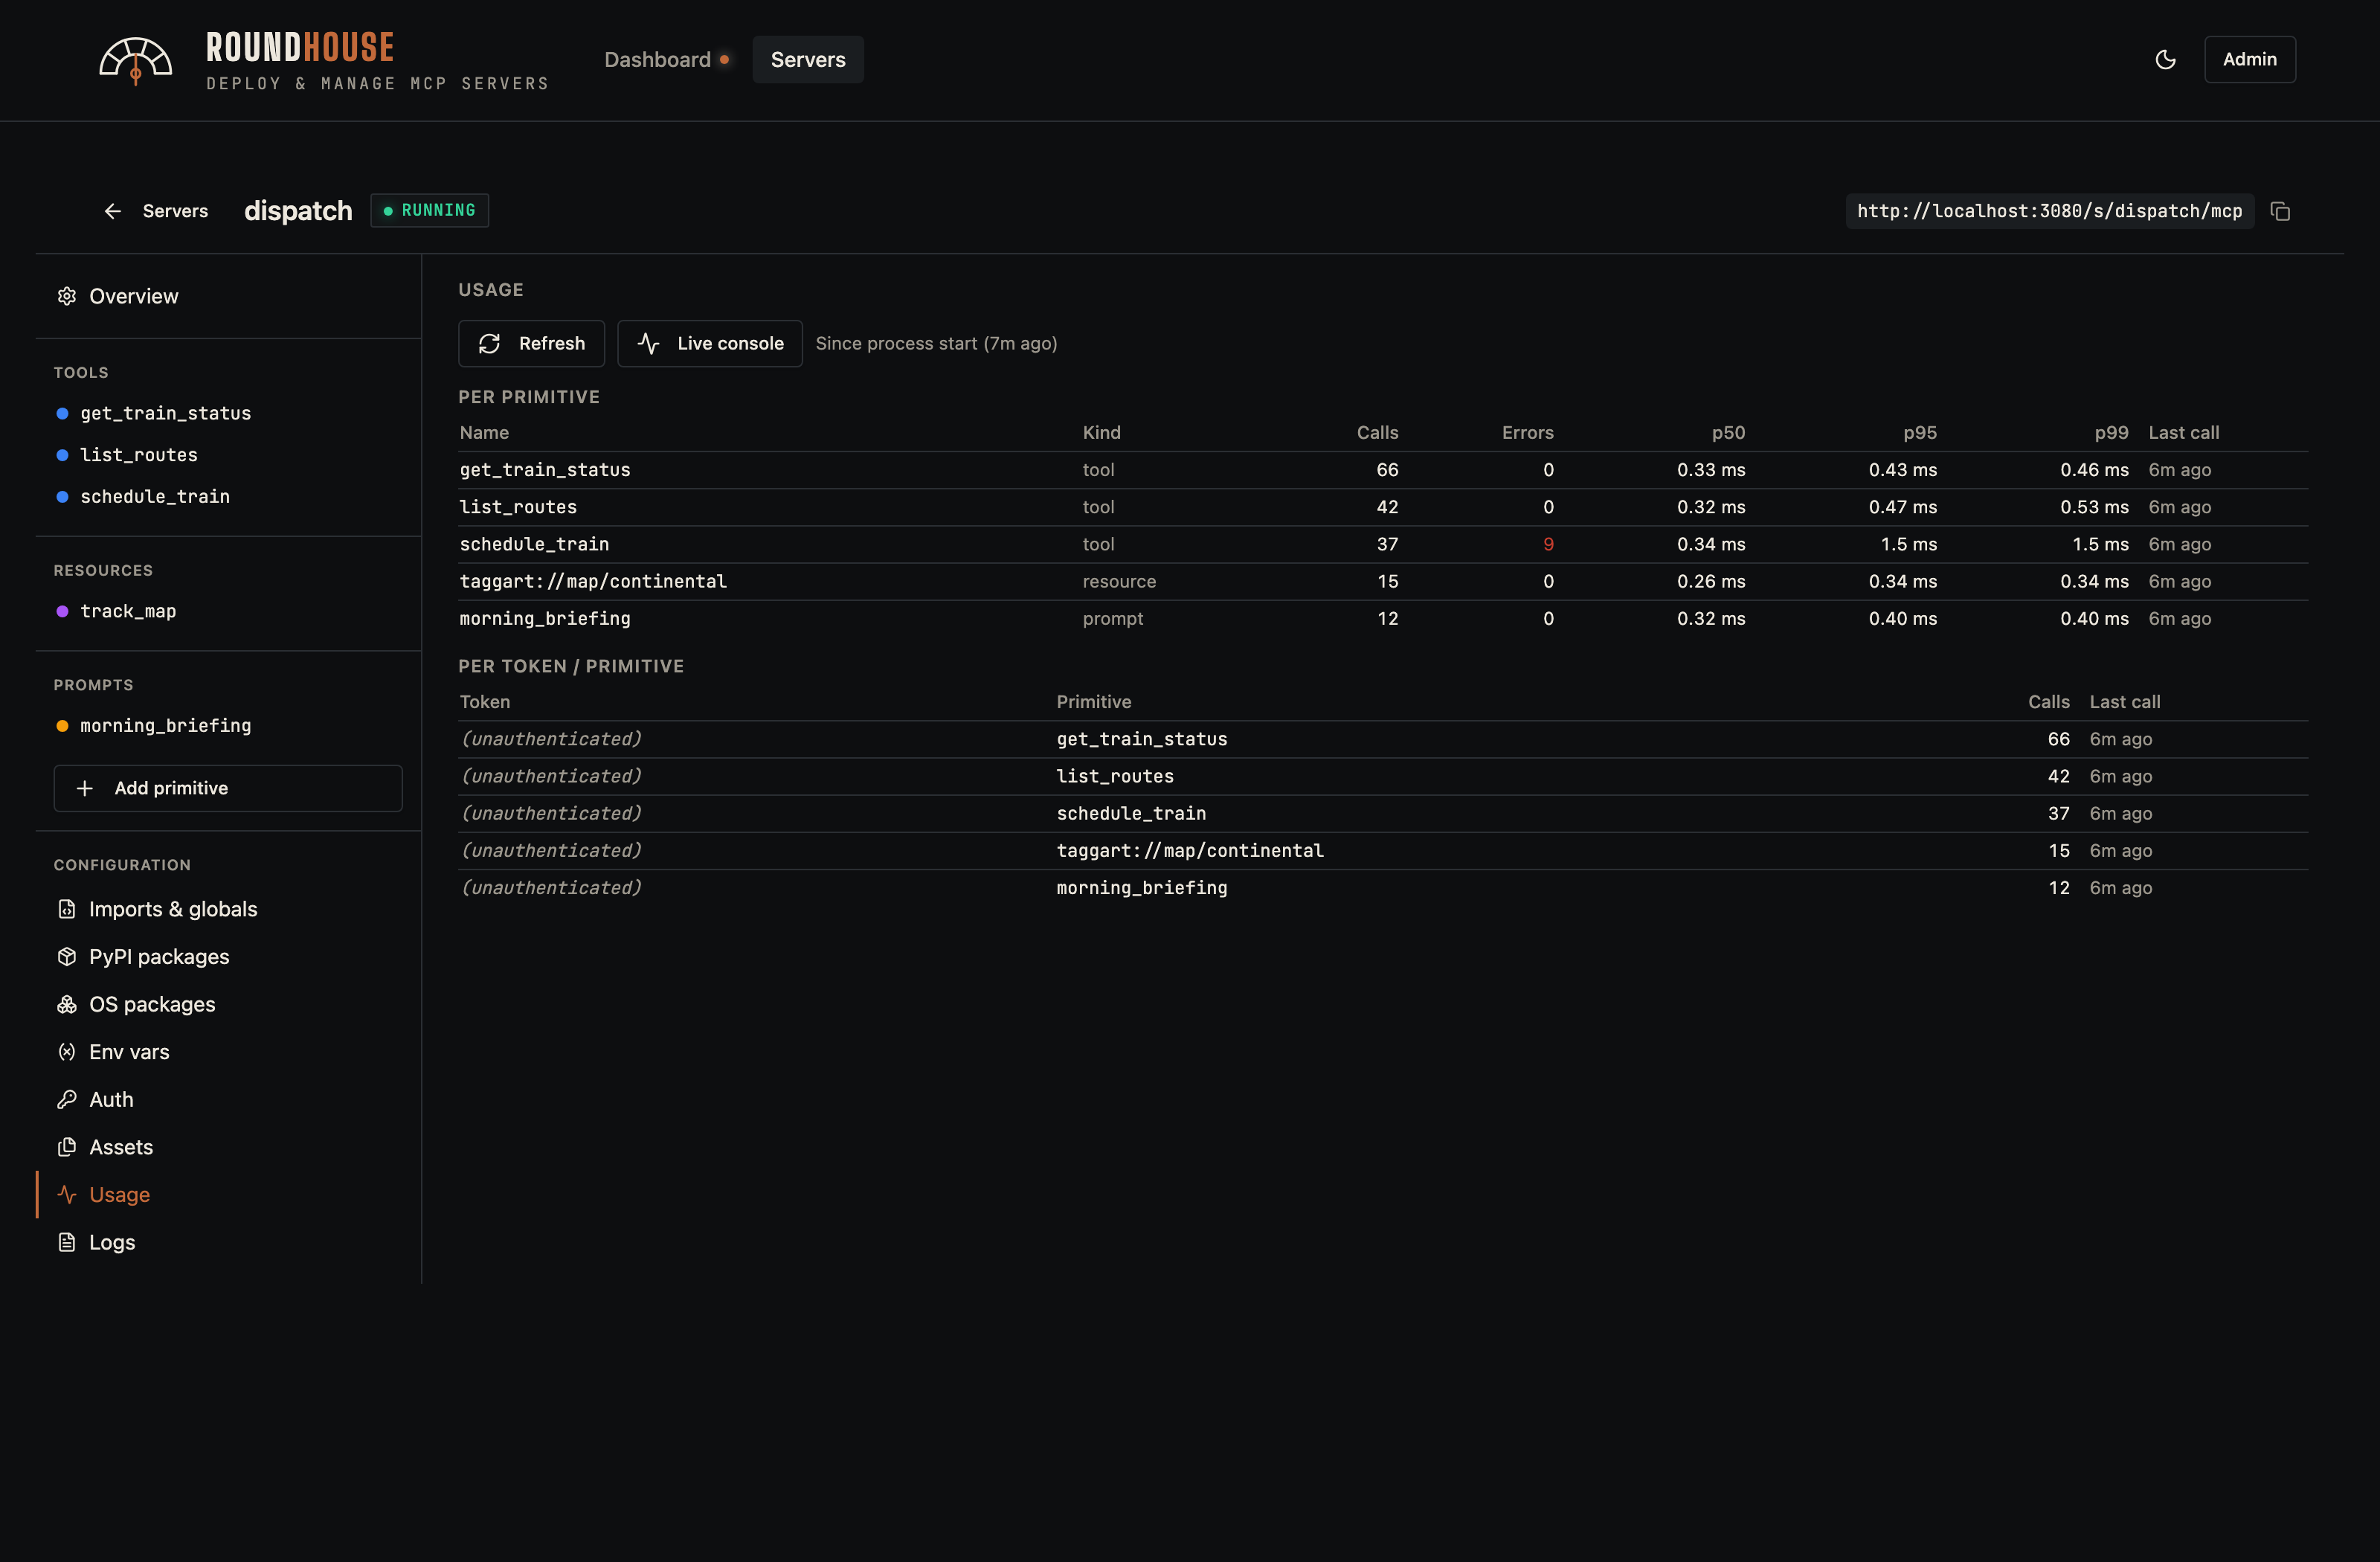
Usage#
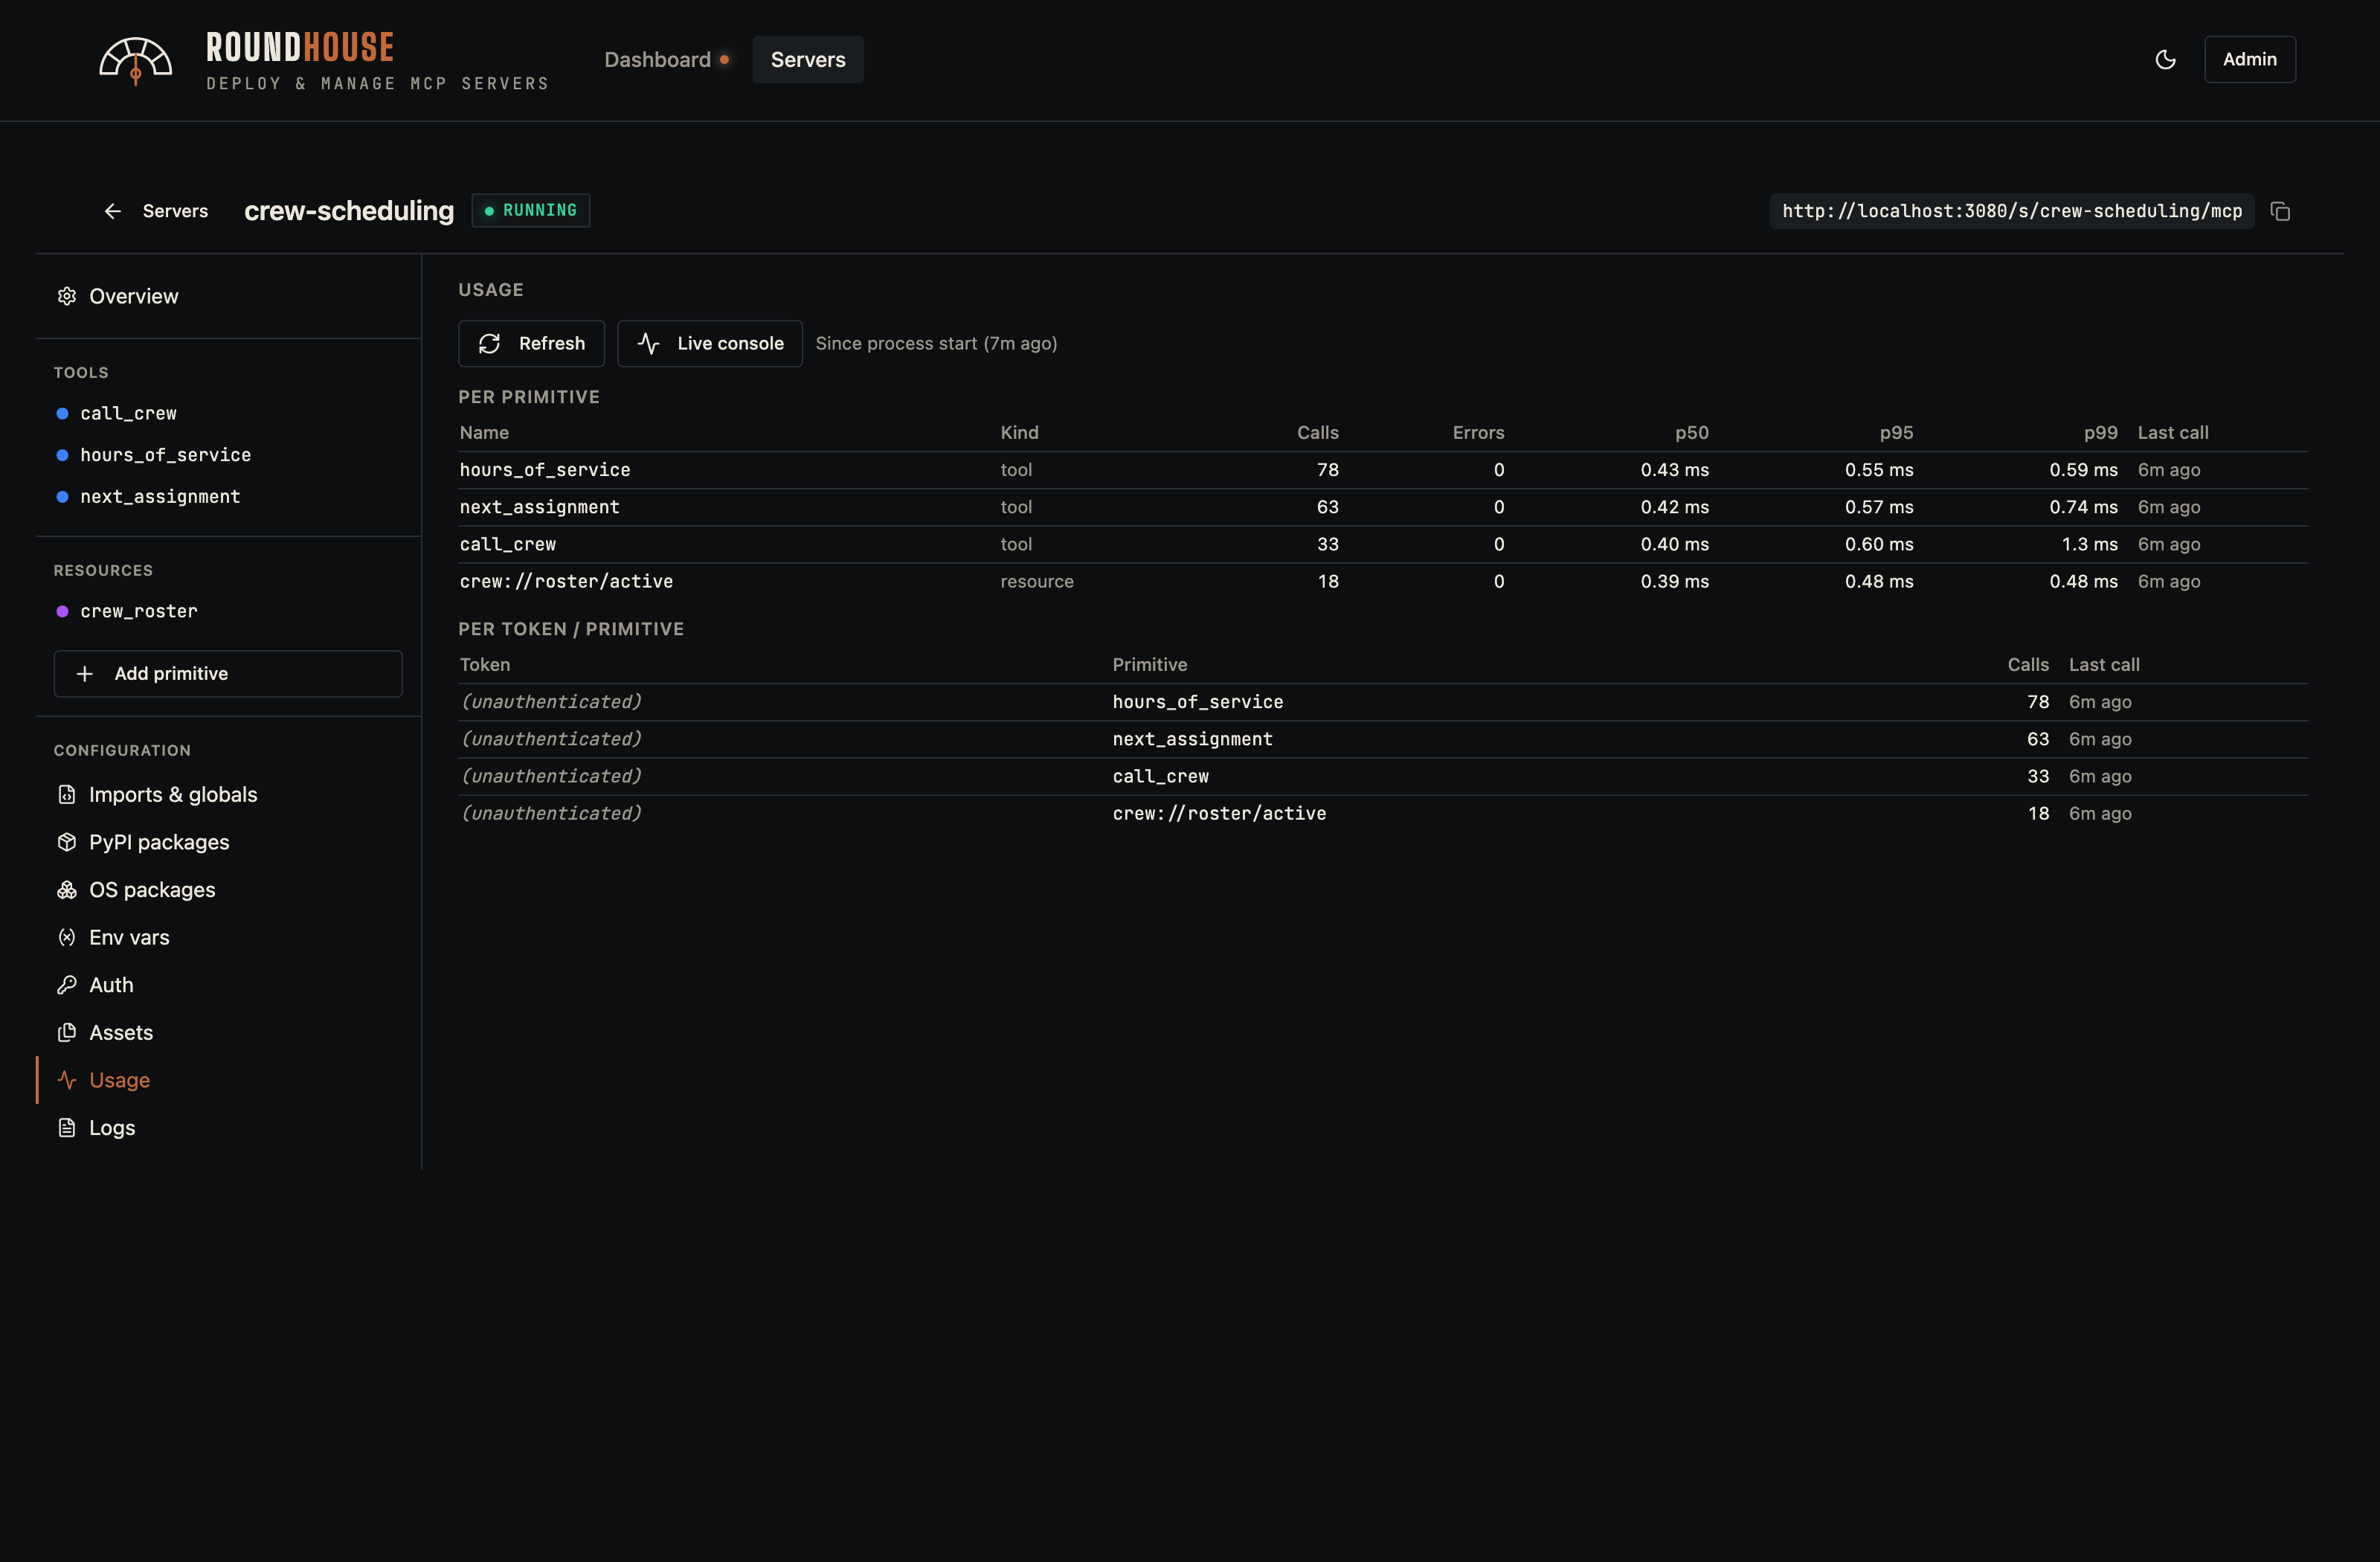
Per-primitive call counts, p50/p95/p99 latency, error rate, and the busiest client tokens. Sampled in-process by the platform middleware and surfaced without an extra metrics backend — no Prometheus, no Grafana, no add-on agent. Drilling into a server's usage tab is how you find latency regressions or the one tool that's getting hammered.
A busier server (crew-scheduling, which carries the heaviest call volume in the demo fleet) makes the chart variety obvious:
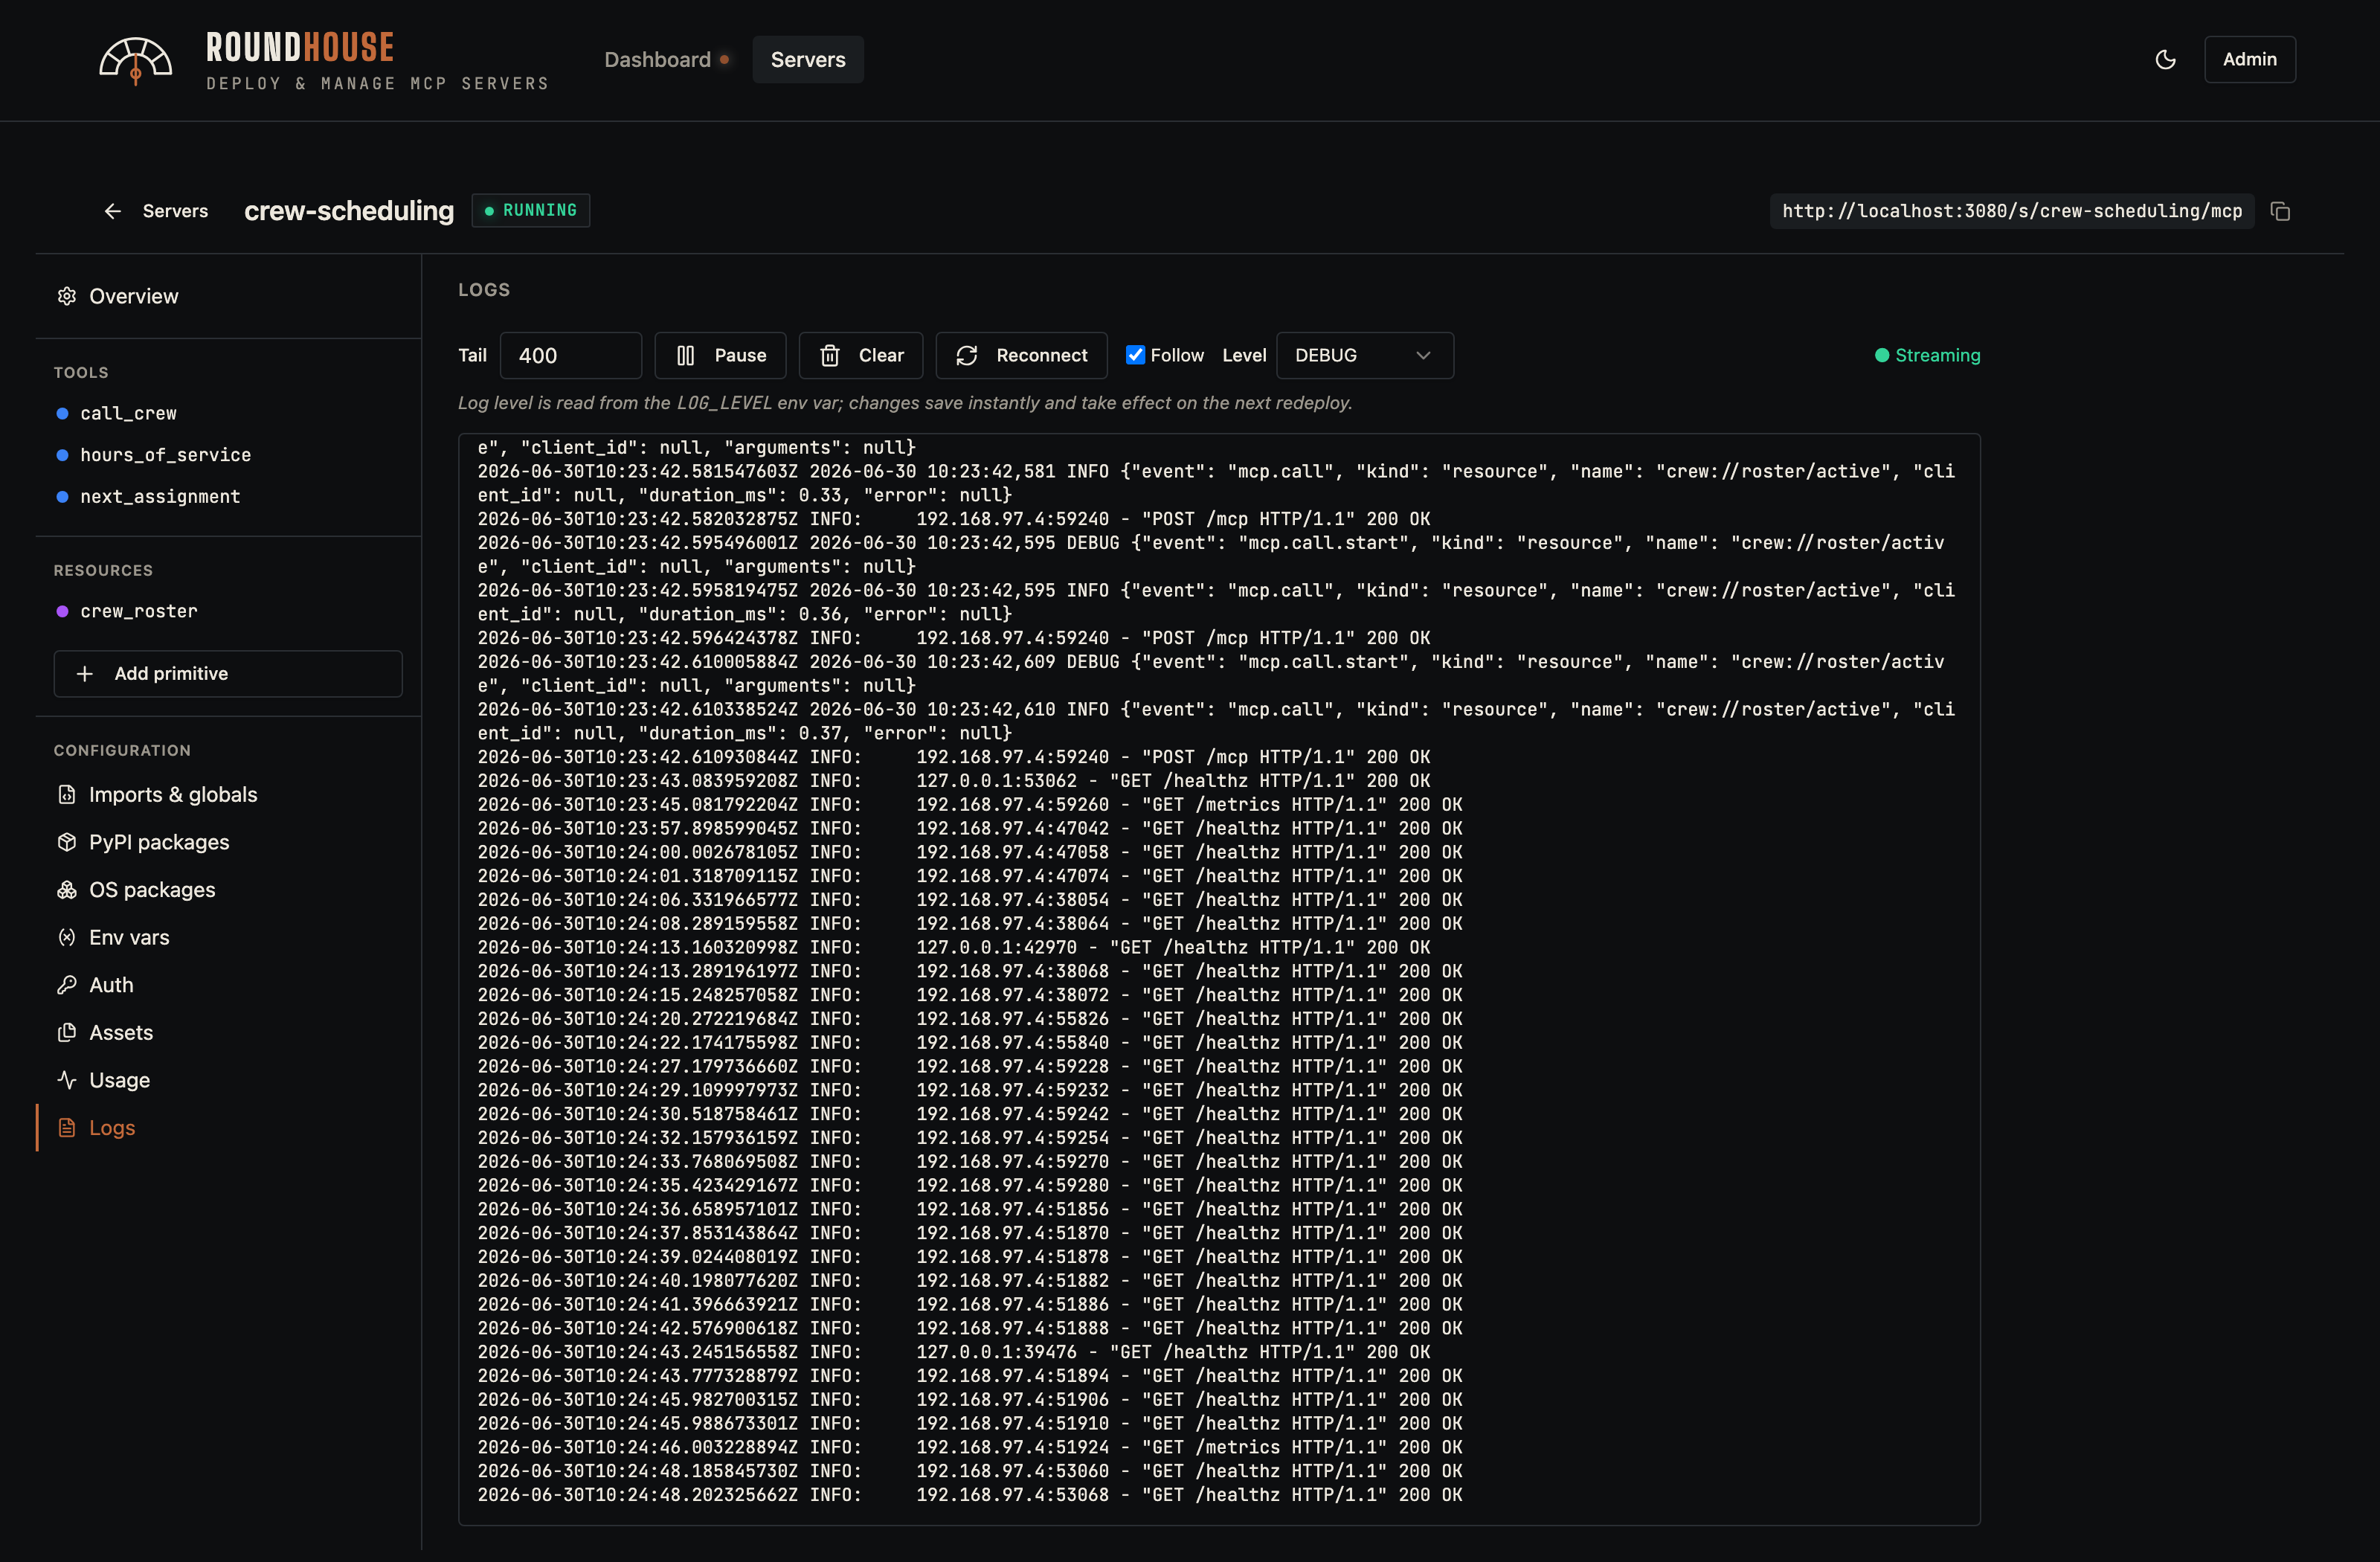
Logs#
Streams stdout/stderr from the server container via Server-Sent Events.
For spec-based servers, the Level dropdown writes the LOG_LEVEL environment variable on the spec; the platform middleware reads it and configures stdlib logging accordingly. At DEBUG, the middleware also emits a start record (with arguments) for every tool/resource/prompt call. Failed calls promote the end-of-call record to WARNING. The dropdown is hidden for code-mode servers, since they own their own logging surface.
Source (code mode)#
For servers in code mode, the editor replaces the primitive surface with a full server.py editor (CodeMirror, Python syntax highlighting). The platform still controls the Dockerfile.
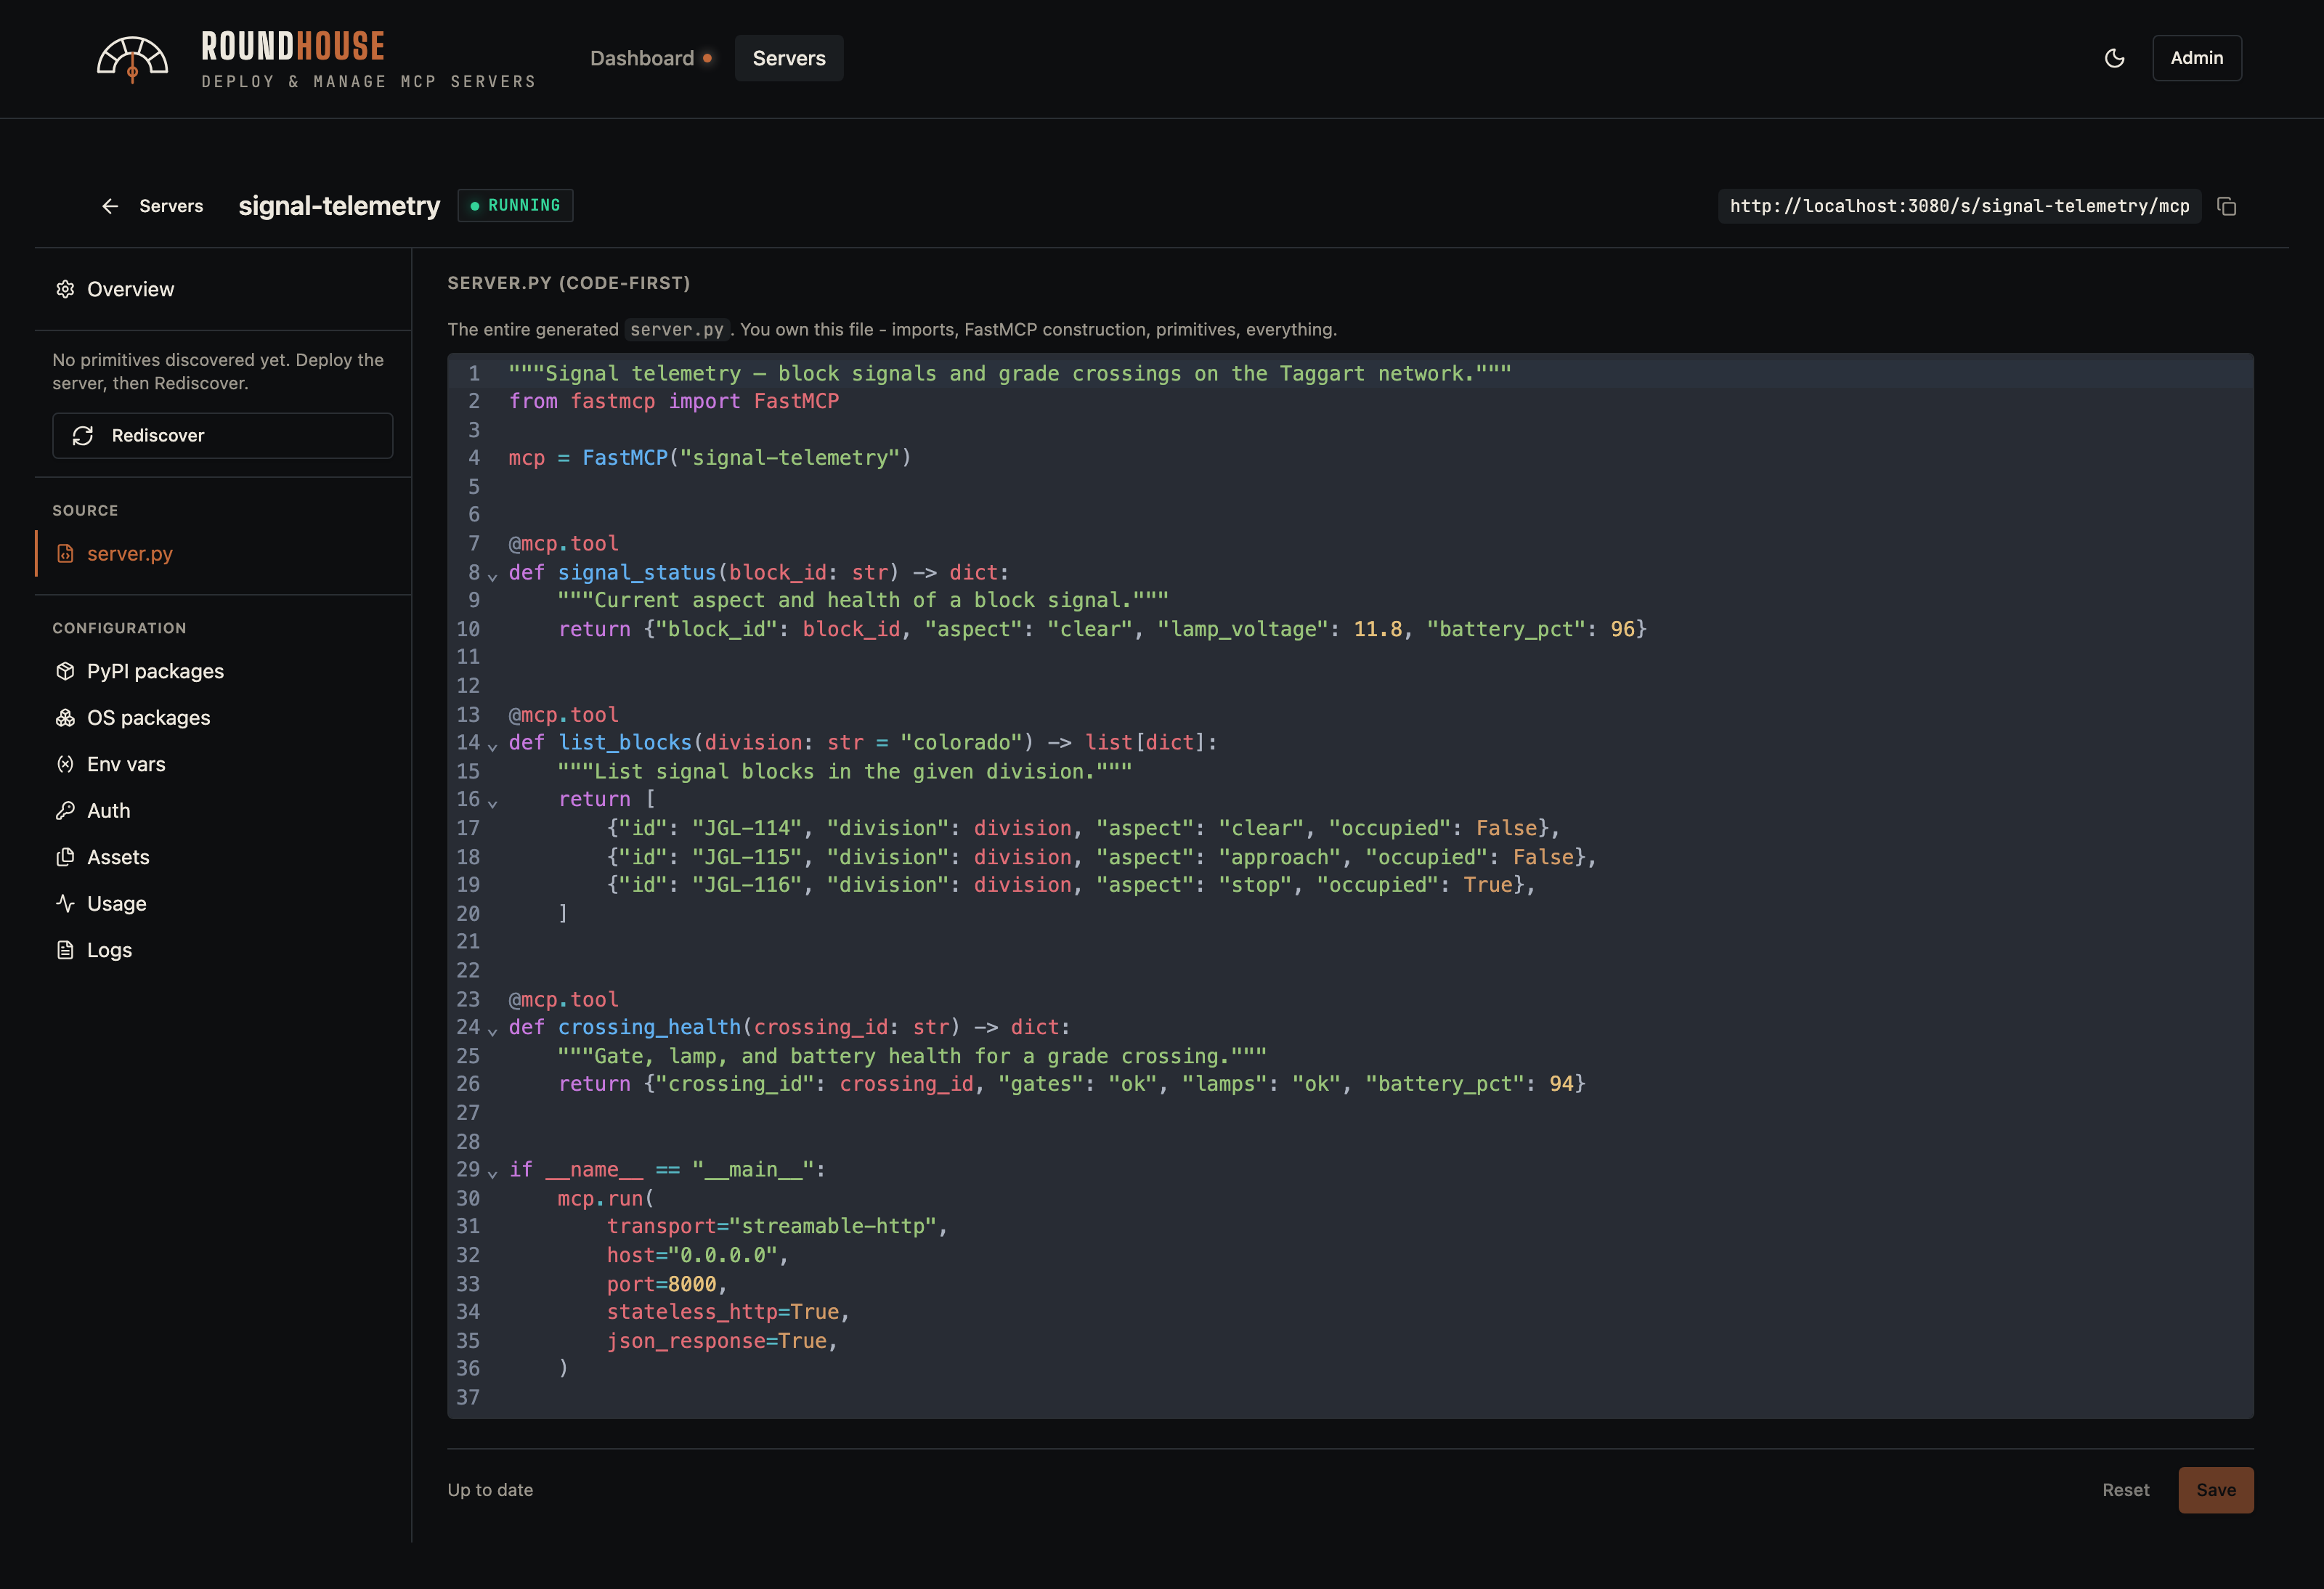
Code-mode servers still expose every operational tab — env vars, logs, usage — so the operator surface is unchanged.
Stopped server#
A stopped server keeps its spec on disk; restarting it reuses the cached image without a rebuild.
Platform administration#
Roundhouse ships with a small set of platform admin views.
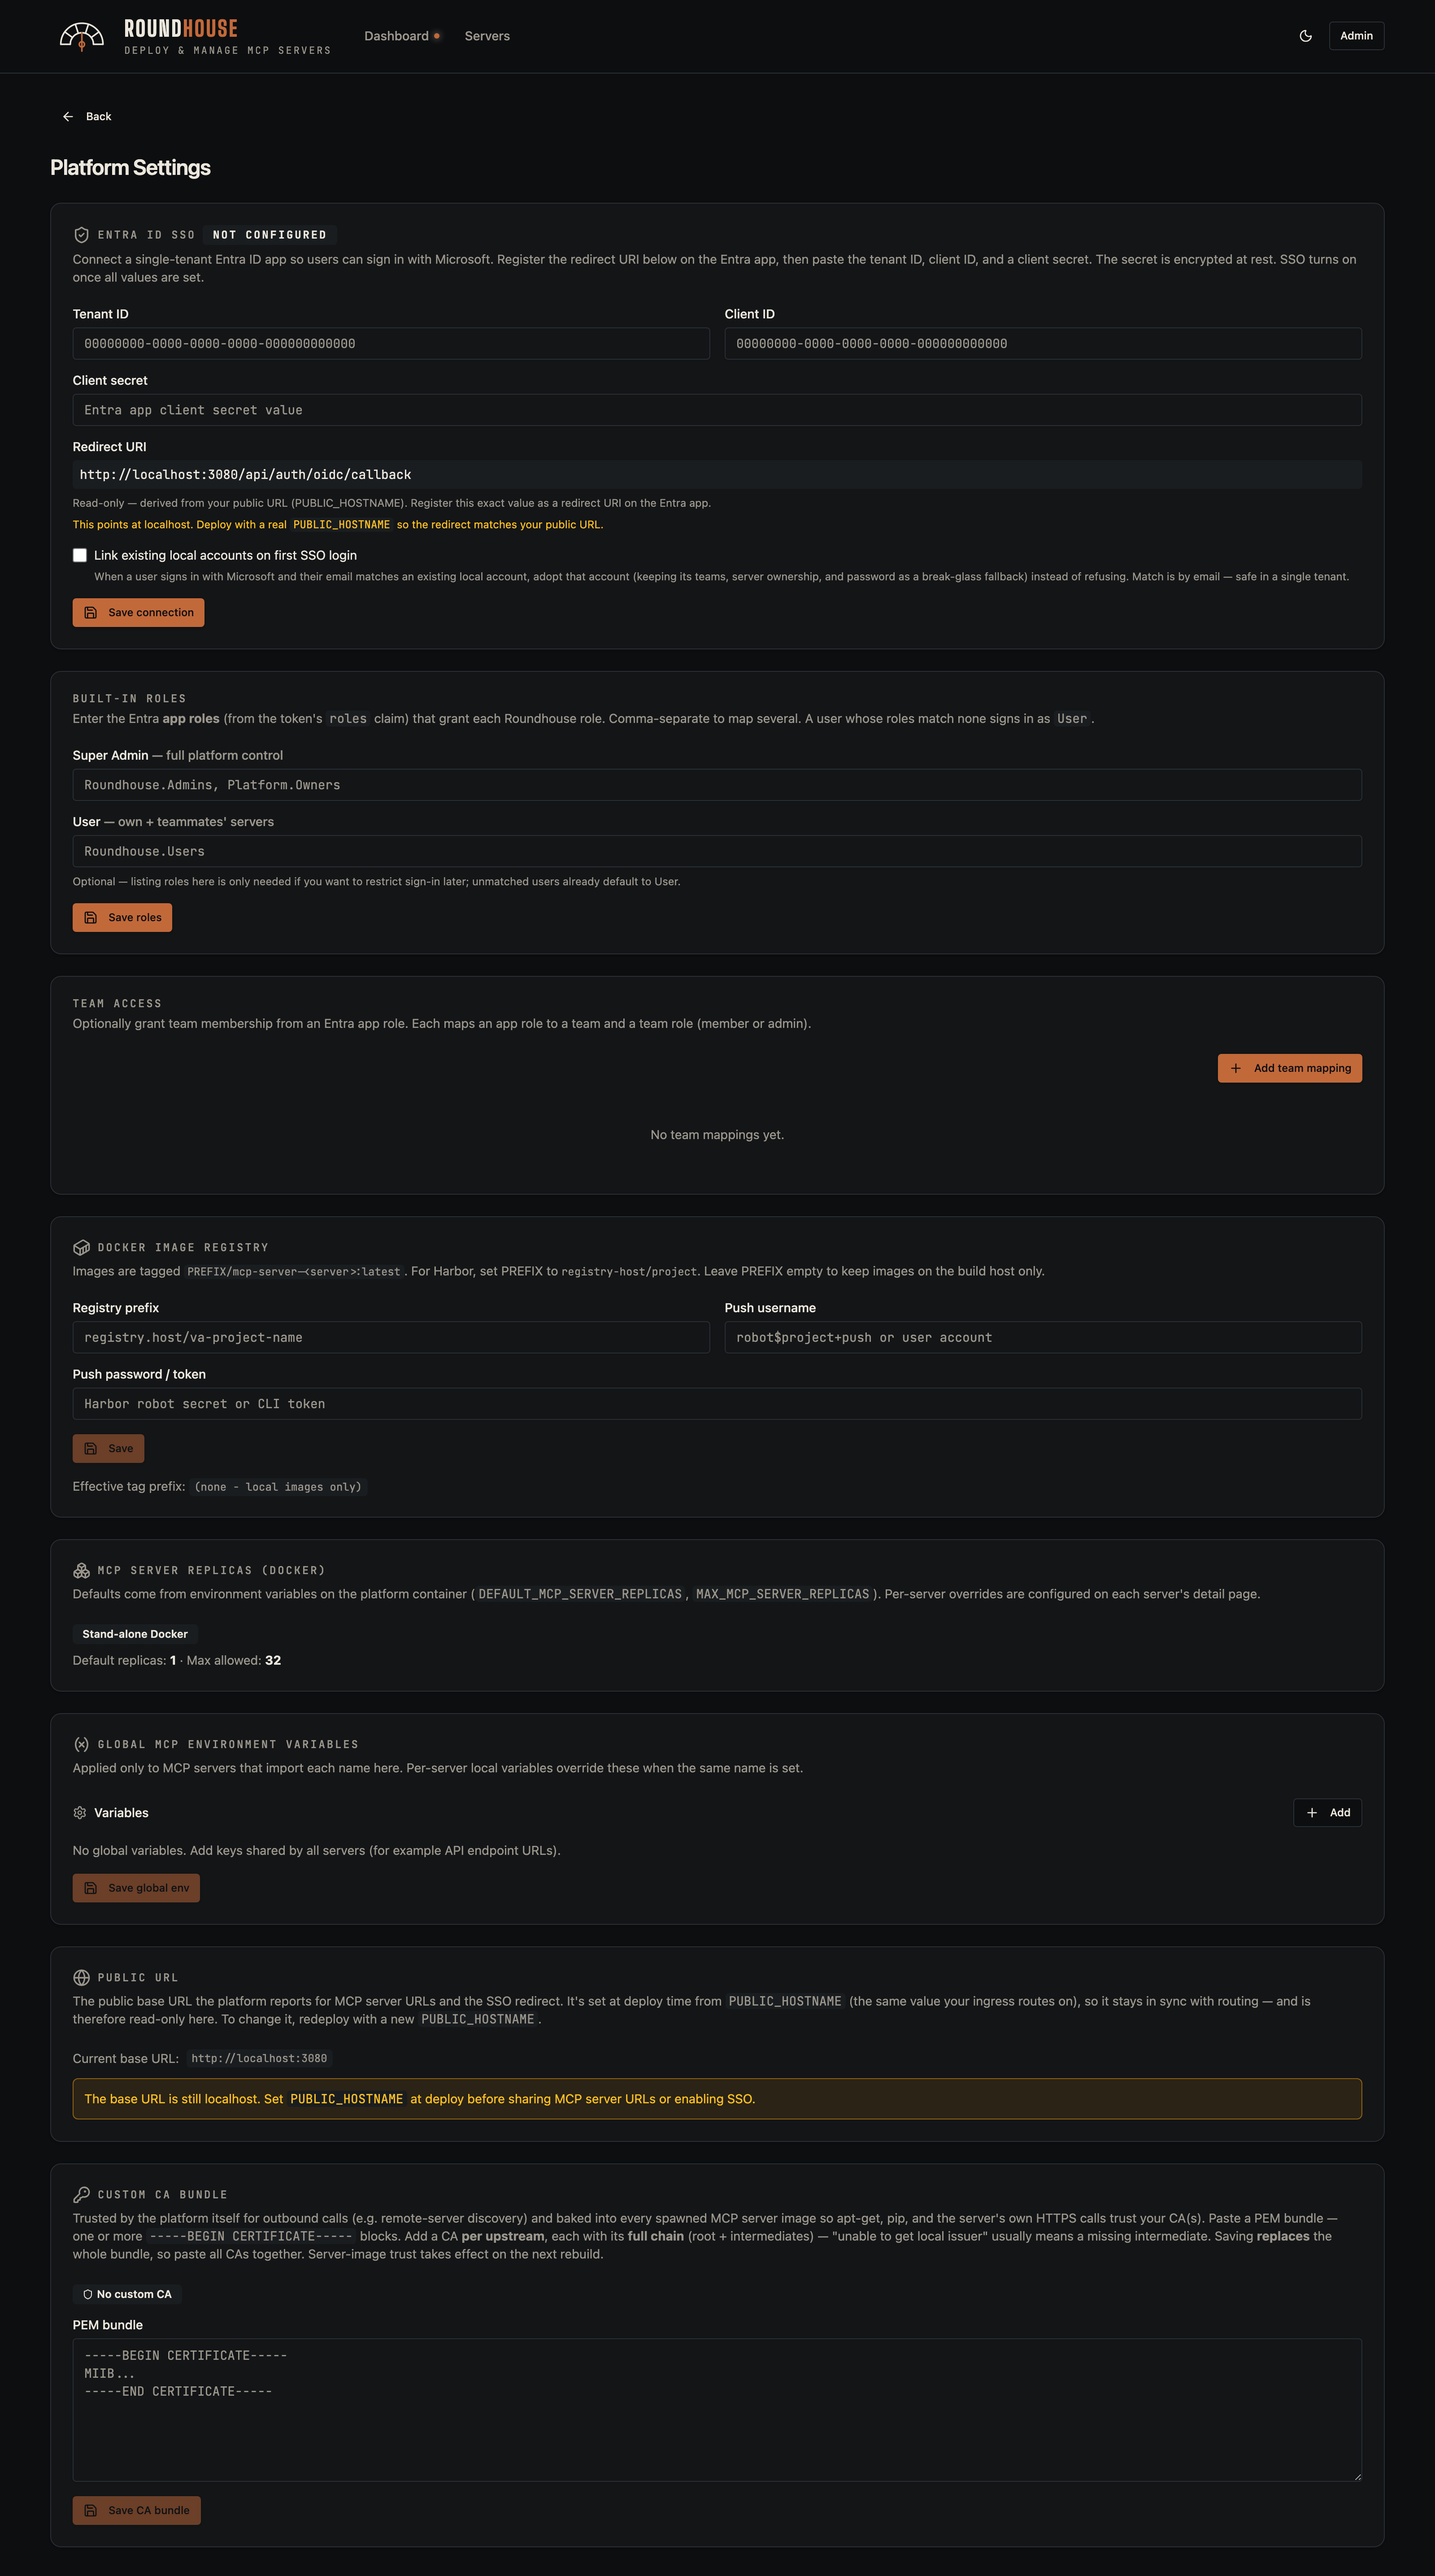
Platform settings#
Host configuration: external hostname, Docker registry credentials, custom CA bundle for outbound TLS, and platform-wide env defaults that get imported into spec-based servers.
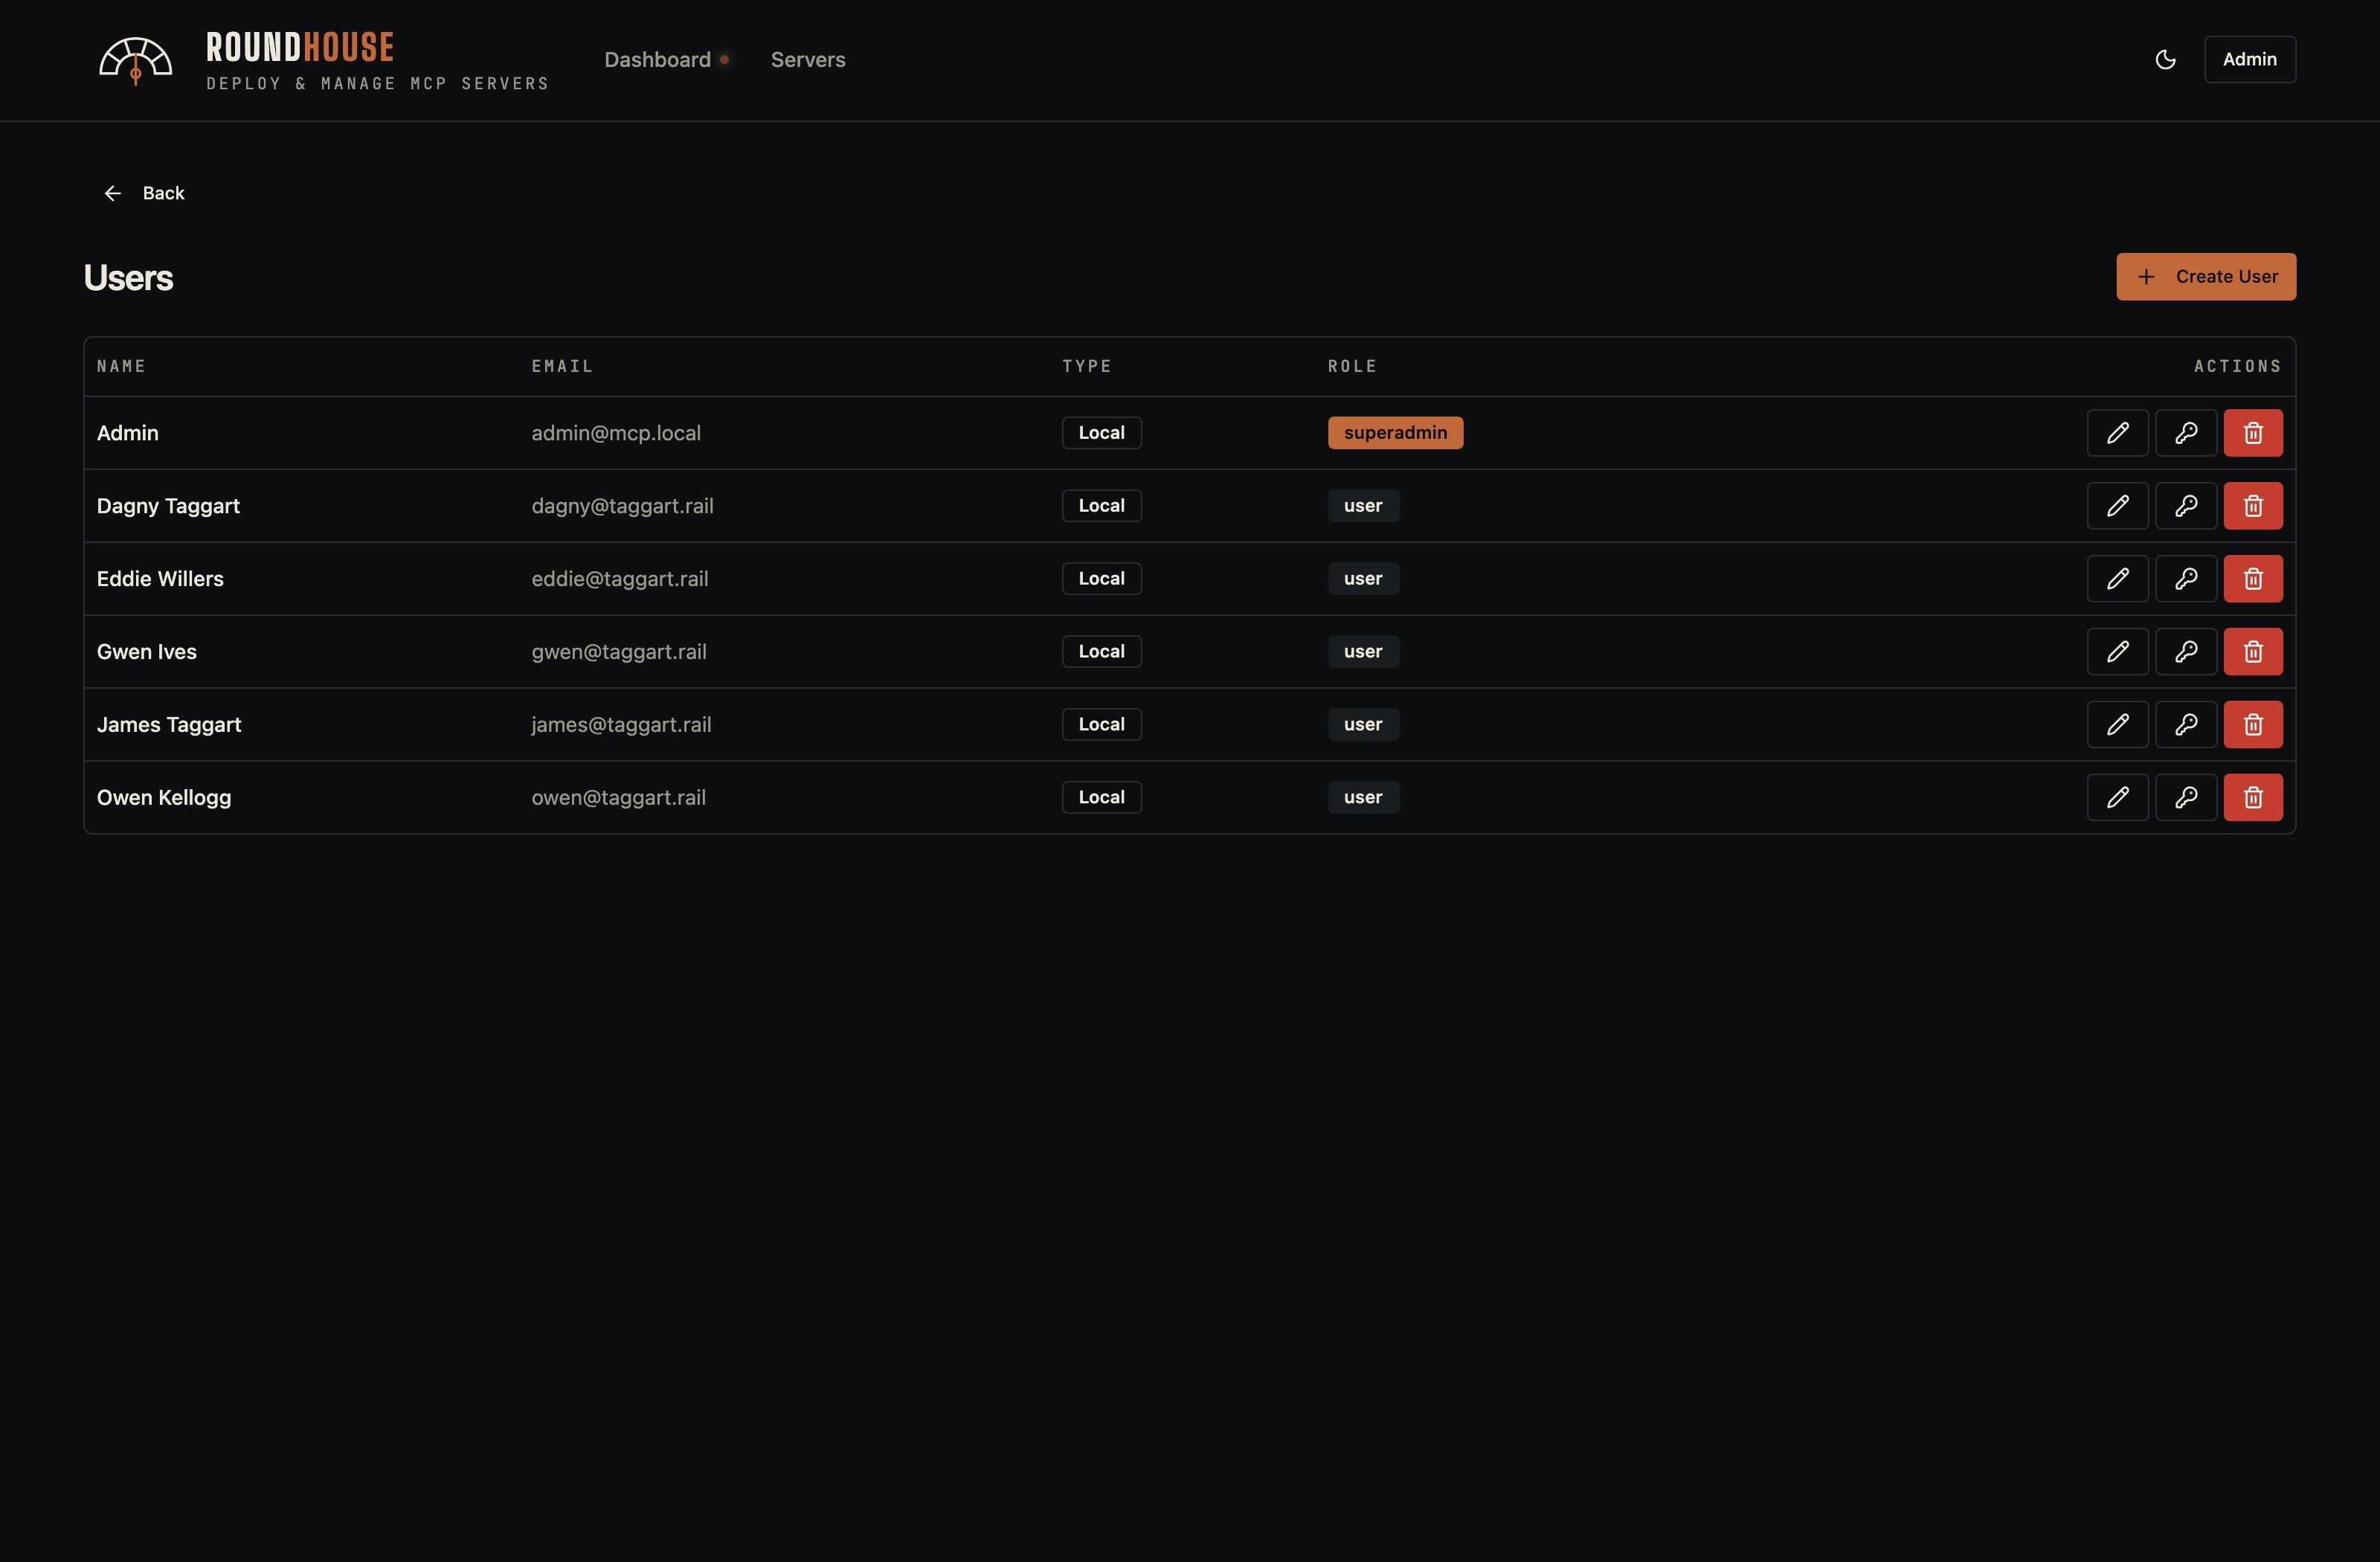
Users#
User accounts with role assignment. The seeded demo includes a handful of operators alongside the platform admin; superadmins can reset passwords and revoke access from this page.
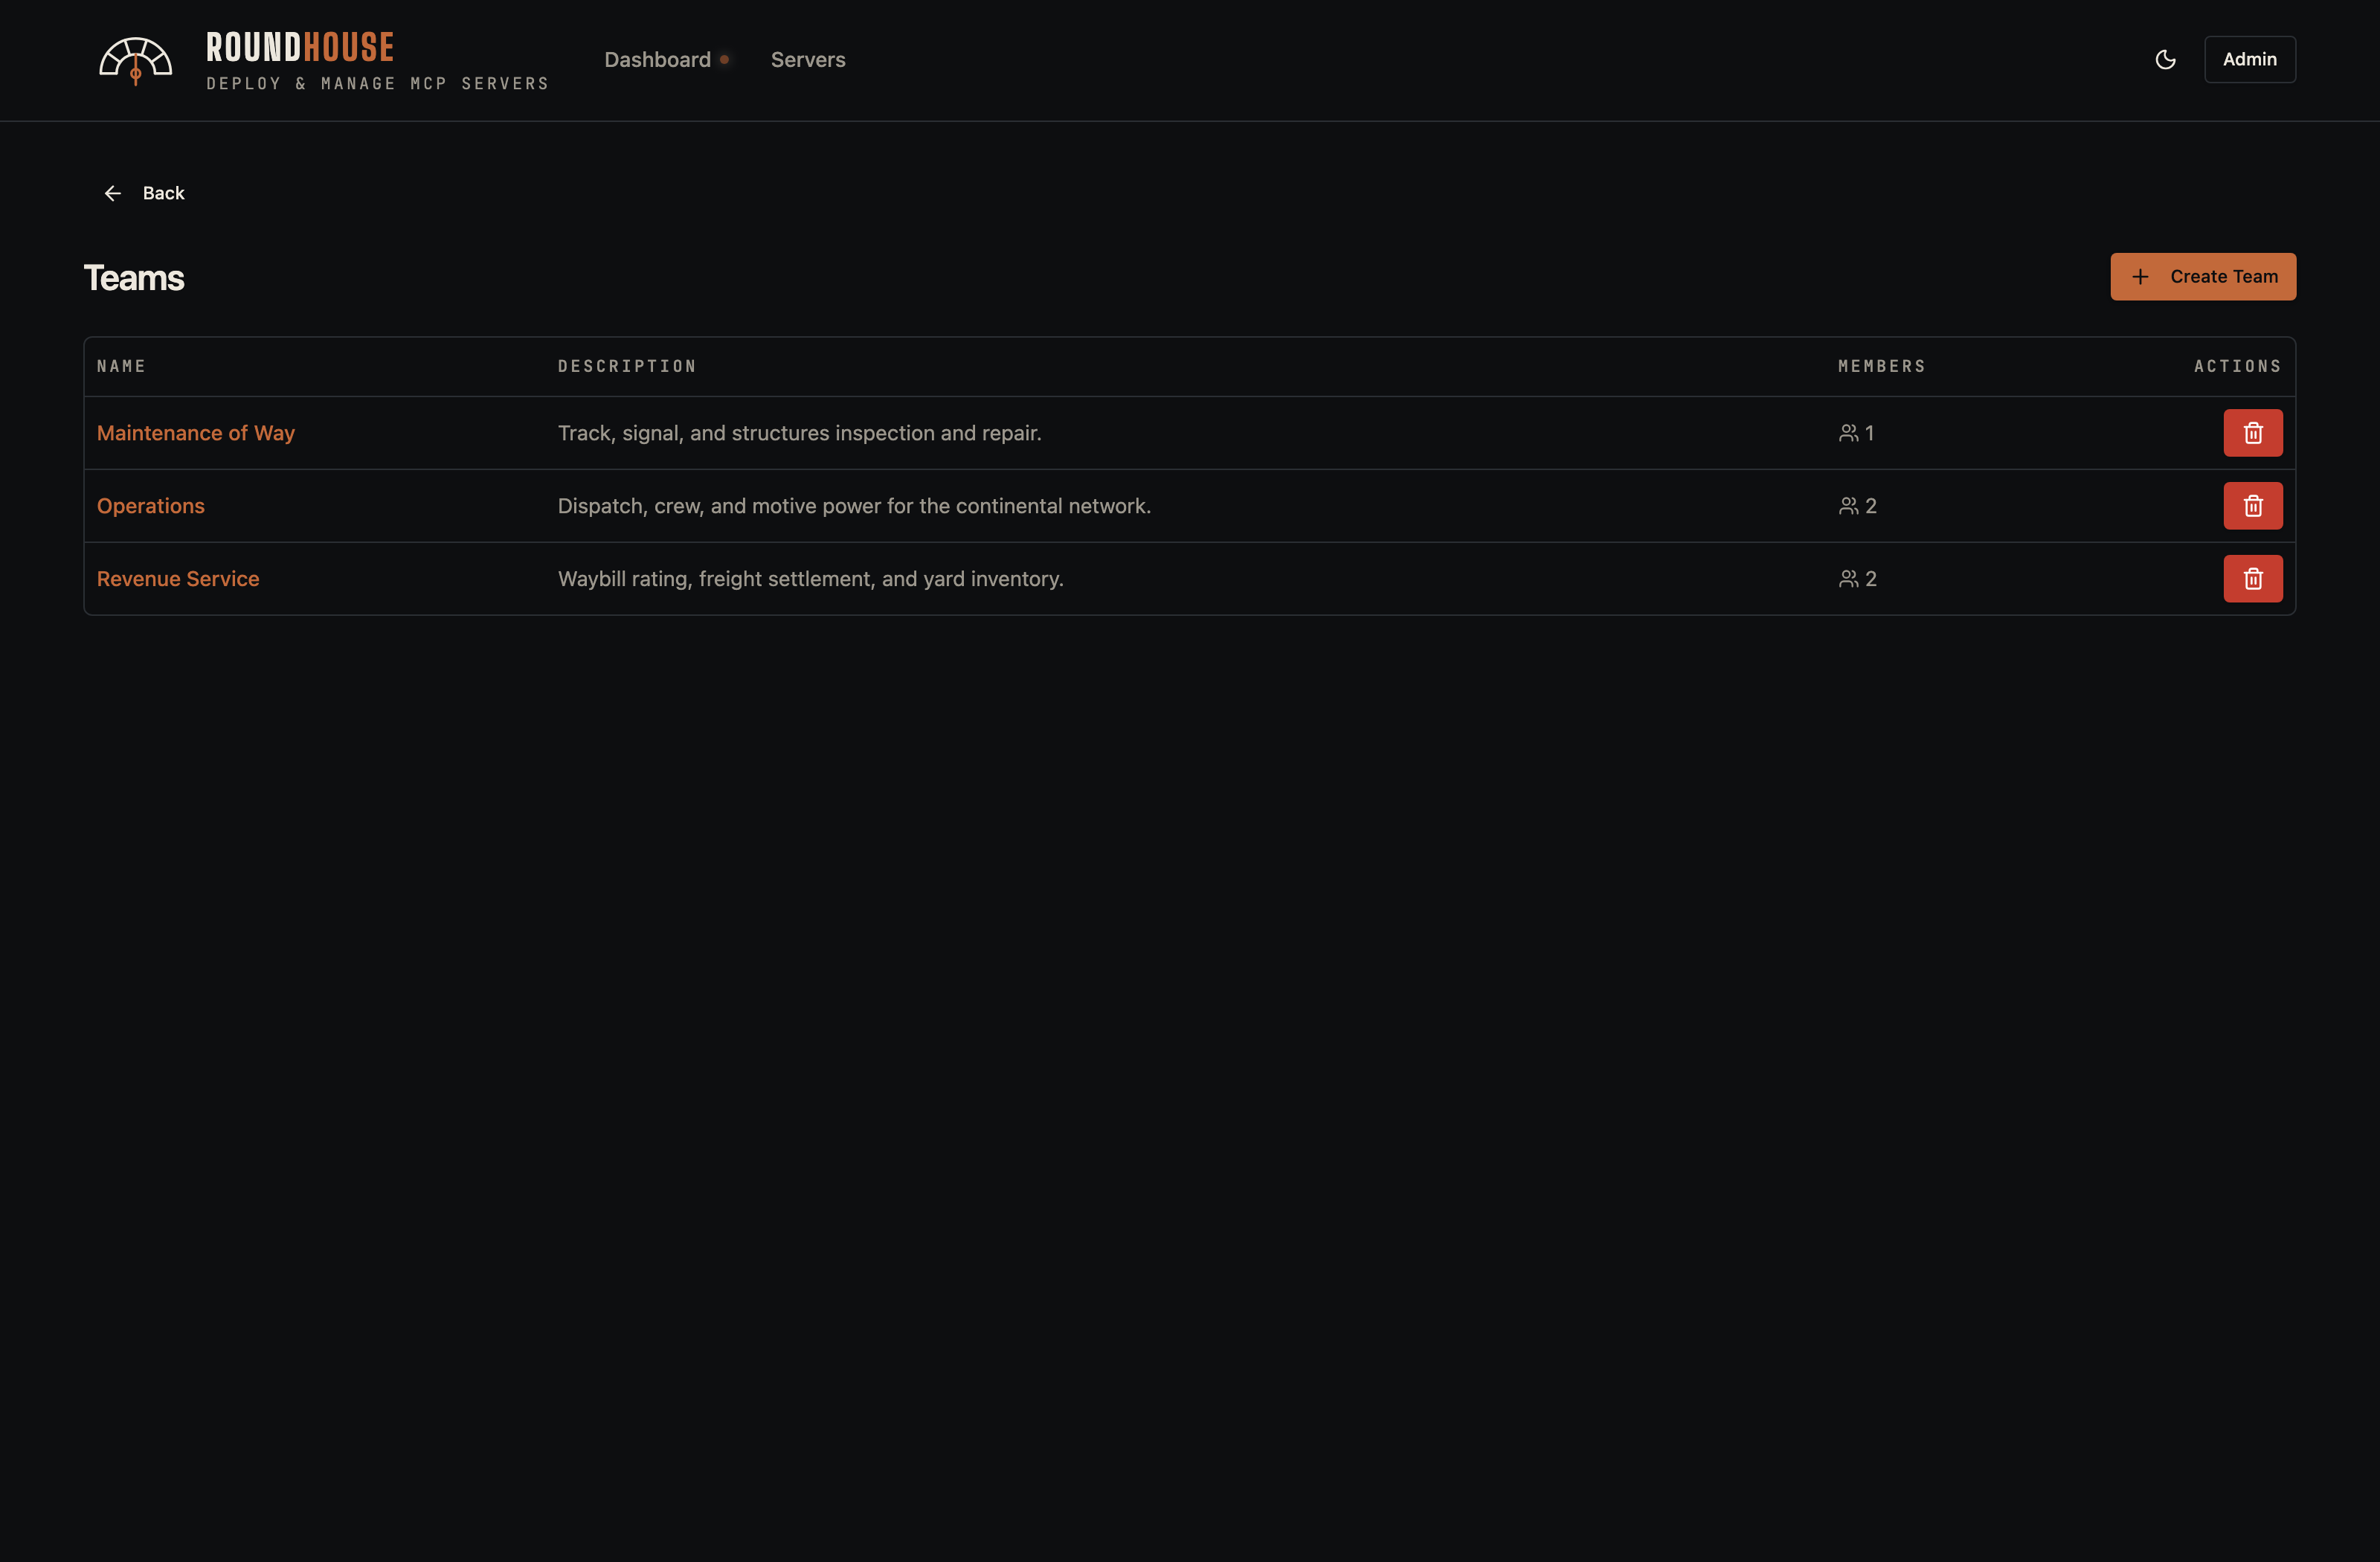
Teams#
Teams group users into shared-access bundles. A team can own one or more servers, and any team member inherits access to those servers without needing per-server token grants. The seeded demo creates three railroad departments — Operations, Maintenance of Way, and Revenue Service — each with its own member roster.
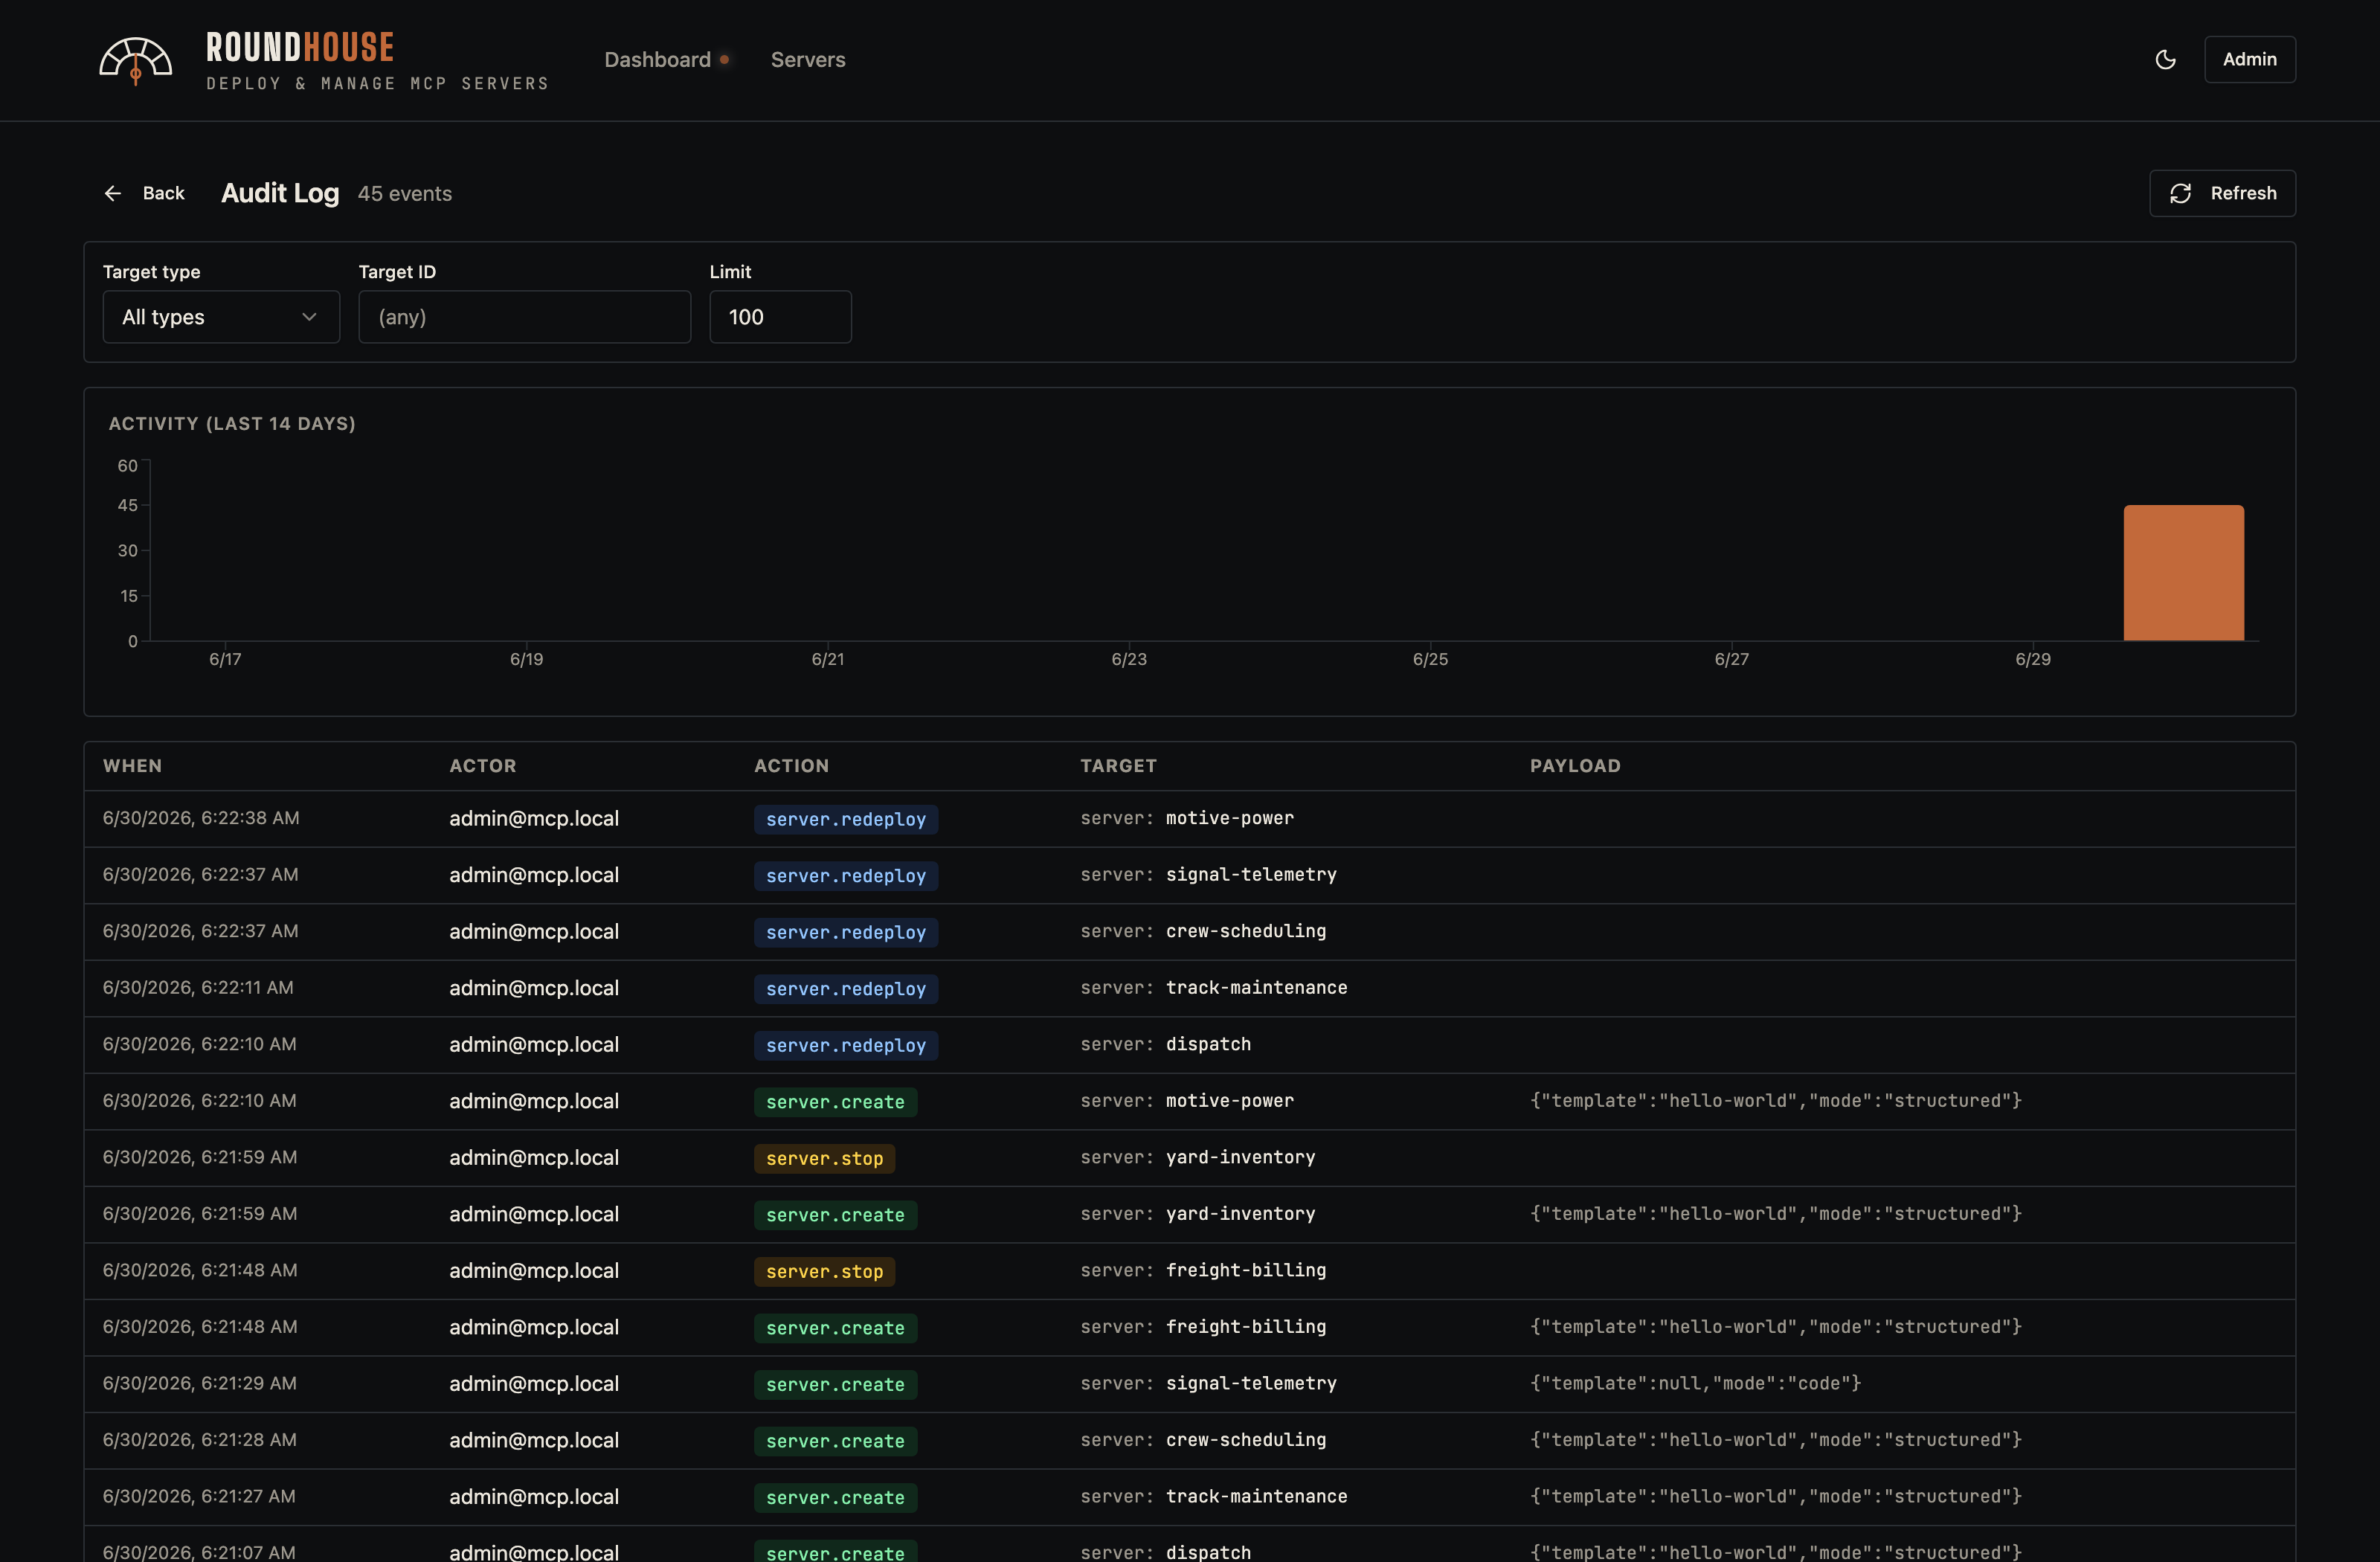
Audit log#
Every state-mutating action — server create/delete, env-var change, token rotation — is recorded with the acting user, target, and a structured detail payload.
Configuration reference#
Everything reads from environment variables — see .env.example for the full list. The knobs you'll actually touch:
| Variable | Purpose |
|---|---|
APP_KEY | base64:<32 random bytes> — encrypts runtime tokens at rest. Generate with printf 'base64:%s' "$(openssl rand -base64 32)". |
MCP_BASE_URL | The URL clients see for spawned servers. Set this when deploying past localhost. |
MCP_DOCKER_HOST | /var/run/docker.sock (default) or tcp://socket-proxy:2375 for hardened Swarm setups. |
MAX_MCP_SERVER_REPLICAS | Per-server replica cap (Swarm only). |
ADMIN_EMAIL / ADMIN_PASSWORD | First-boot seed user. Ignored once a user exists. |
Behind a corporate TLS-inspecting proxy#
The published image needs no build, so this only applies if you build from source (docker-compose.dev.yml or your own image). If your network MITMs outbound TLS during image builds, drop the proxy's CA bundle at api/docker/corp-ca.crt before building. The Dockerfiles pick it up automatically; the file is gitignored so it can't be committed by accident. In any other environment, leave it absent and the build skips that step.
Deployment modes#
| Mode | File | Best for |
|---|---|---|
| Local / single-host | docker-compose.yml | Trying it out, small teams, hosting on one box. Pulls the published image — no clone or build. Single Docker daemon, Traefik on the same socket. |
| Docker Swarm | docker-stack.yml | Multi-node, scoped socket proxies. Designed to sit behind a cluster ingress that terminates TLS. |
Both modes are fully self-contained — well suited to air-gapped and restricted networks where outbound connectivity and cloud integrations aren't an option.
Extending the Swarm stack#
The shipped docker-stack.yml is fully self-contained: it references only public images (the Roundhouse platform-api image is published to GHCR), configures its embedded Traefik via CLI flags, and depends on no other file in this repository. Deploying needs nothing but the stack file itself — download docker-stack.yml, write a small overlay for your environment, and docker stack deploy. There's no clone, no local build, and no upstream to track.
Anything specific to your environment — a front reverse-proxy network, node placement, a pinned image version, extra labels — belongs in a separate overlay file you own, layered on at deploy time rather than edited into the base. Keeping site-specific changes out of the base is what lets you drop in a new release of docker-stack.yml without re-applying your edits.
Docker Swarm merges multiple stack files left to right, so you point docker stack deploy at both:
docker stack deploy \
  -c docker-stack.yml \
  -c docker-stack.override.yml \
  roundhouse
A ready-to-copy starting point lives at docker-stack.override.example.yml. Copy it to docker-stack.override.yml, keep the blocks you need, and edit.
How the merge behaves#
Two rules cover almost everything you'll want to add:
- Service
networksare unioned. Listing a network under a service in the
overlay adds it — the service keeps the networks the base gave it. This is how you attach the embedded Traefik to your front proxy network without touching the base file.
- Placement
constraintsappend, and Swarm ANDs them. Overlay constraints
are added to whatever the base declared. Because they AND together, an overlay can only make scheduling more restrictive — it cannot remove a constraint the base set. So the base carries only universally-true constraints; anything topology-specific goes in your overlay.
Render the merged result before deploying — this resolves both files and prints the final stack without deploying anything:
docker stack config -c docker-stack.yml -c docker-stack.override.ymlFront reverse-proxy network#
When an upstream proxy terminates HTTPS and forwards HTTP into this stack, the embedded Traefik needs to share a network with it. Attach it in the overlay:
services:
  traefik:
    networks:
      - public

networks:
  public:
    external: true
    name: ${PUBLIC_INGRESS_NETWORK:-public-ingress}
external: true means Docker will not create the network — it must already exist before you deploy, owned by whatever runs your ingress. Create it once with docker network create --driver overlay --attachable <name> (or let your front proxy — Caddy, nginx, Traefik, … — create it), and set PUBLIC_INGRESS_NETWORK if the real name differs from the default.
Pinning a service to a node#
To keep a stateful service on a particular node — say Postgres on the box with fast persistent storage — label the node and constrain the service:
services:
  postgres:
    deploy:
      placement:
        constraints:
          - node.labels.db == true
Label the target node once with docker node update --label-add db=true <node>. The base pins nothing, so this is the effective constraint; if you add several, Swarm ANDs them together. The same pattern works for any service — repeat the deploy.placement.constraints block under platform-api, traefik, or any other service that needs to be pinned or co-located. A complete, copy-ready overlay combining this with the reverse-proxy attachment is in docker-stack.override.example.yml.
Pinning the image version#
The base references ghcr.io/karmatek-consulting-llc/roundhouse:latest, which moves as new builds publish. For production, pin a specific released version in your overlay so upgrades are deliberate rather than picked up on the next redeploy:
services:
  platform-api:
    image: ghcr.io/karmatek-consulting-llc/roundhouse:v1.2.3
The same block points platform-api at your own registry if you build the image yourself instead of pulling the published one.